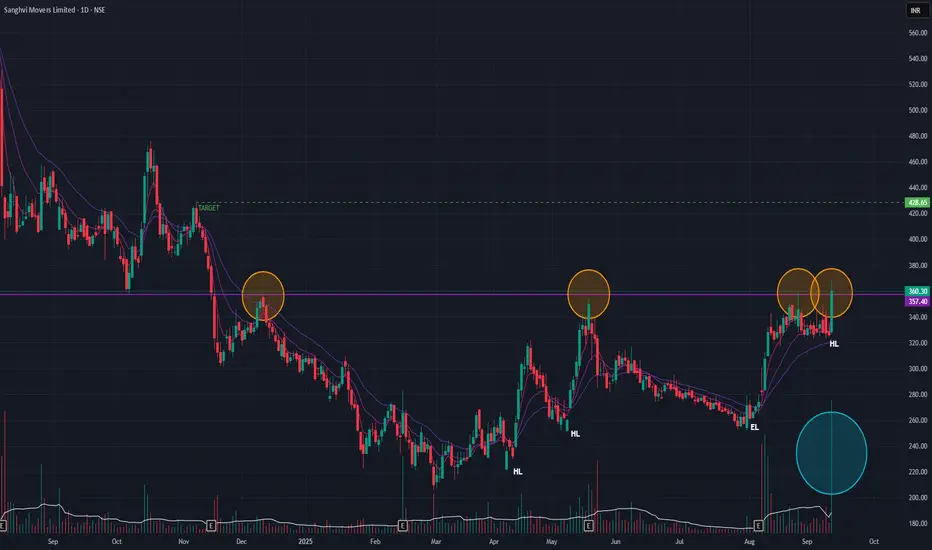
Sanghvi Movers has been in a corrective downtrend since peaking at its all-time high in May 2024. A notable shift in market structure appeared in March 2025, with the stock starting to print a series of higher lows—an early sign of a potential trend reversal.
A significant horizontal resistance, established in August 2023, has capped multiple rally attempts. Today, however, the stock challenged this level with conviction, closing +10.45% higher on massive volume, which suggests strong institutional interest. Bullish sentiment is further reinforced by a recent Simple Moving Average (SMA) Golden Cross.
While we await a confirmatory Positive Crossover (PCO) on the short-term Exponential Moving Averages (EMAs), a sustained breakout above this resistance could signal the start of a new uptrend. The next logical price target on a successful breakout would be the ₹428 zone.
Disclaimer: This analysis is my personal view & for educational purposes only. They shall not be construed as trade or investment advice. Before making any financial decision, it is imperative that you consult with a qualified financial professional.
Exención de responsabilidad
The information and publications are not meant to be, and do not constitute, financial, investment, trading, or other types of advice or recommendations supplied or endorsed by TradingView. Read more in the Terms of Use.