Intraday Technical Outlook (15m Chart)
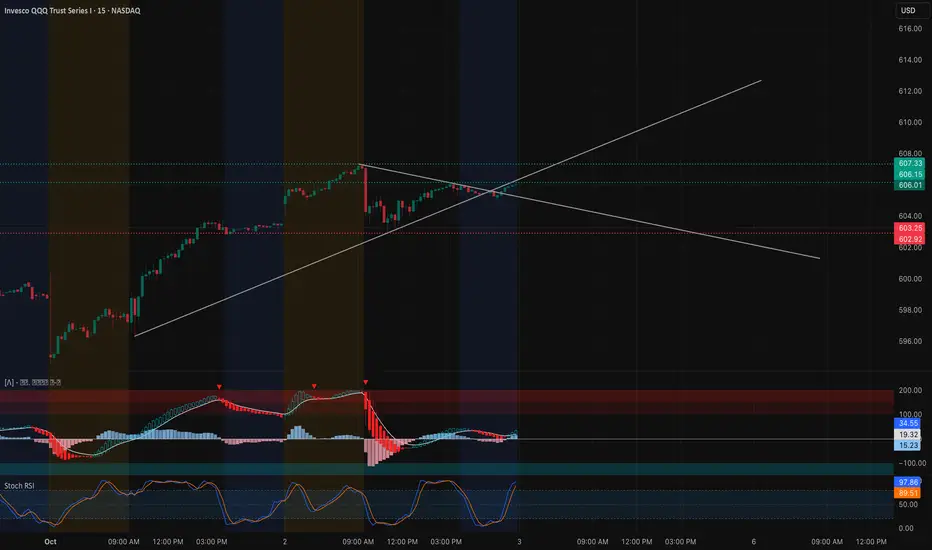
The QQQ closed near $606.01, coiling into a wedge formation after a strong upward push. On the 15-minute chart, the price is sitting right at a confluence of support and resistance trendlines:
* MACD: Starting to recover after a bearish dip, showing early signs of momentum turning back positive.
* Stoch RSI: Pushing back toward overbought, suggesting buyers are regaining control, but overextension risk remains.
* Key Levels: Support sits at $603–602.9, with a deeper floor at $600. Resistance is overhead at $608–610, aligning with the wedge breakout zone.
Intraday takeaway: QQQ is set for a decisive move. Above $608, it could press into $610+, but losing $603 risks a flush back into $600.
Options Sentiment & GEX Outlook (1H Chart)

Gamma exposure highlights a clear battleground for tomorrow’s session:
* Gamma Walls:
* $606–608: Major call resistance cluster and highest positive GEX zone.
* $600: Gamma pivot and HVL level — critical support where dealers may defend.
* $595–590: Heavy put walls below, acting as downside magnets if $600 breaks.
* Implications:
* Holding above $603–606 keeps price magnetized toward $608–610.
* A breakdown under $600 would trigger dealer hedging pressure, driving the Qs toward $595–590.
* Volatility Context: IVR at 17.8 is low, while options positioning skews bearish with 44.8% puts. This suggests traders are hedged defensively, which could amplify a sharp move either way.
My Thoughts & Recommendation
For Oct 3 trading, QQQ is boxed into a gamma range with clear pivot levels:
* Intraday (scalping/trading): Favor longs above $606, aiming for $608–610 breakout. Shorts become attractive on rejections near $608 with downside into $603 and $600.
* Options trading (swing/0DTE): Calls only make sense if QQQ breaks $608 with volume, targeting $610+. If QQQ loses $603 and especially $600, puts toward $595 offer better risk/reward.
Bias heading into Oct 3: Neutral with breakout potential — $608 is the level that decides.
Disclaimer: This analysis is for educational purposes only and does not constitute financial advice. Always do your own research and manage risk before trading.
The QQQ closed near $606.01, coiling into a wedge formation after a strong upward push. On the 15-minute chart, the price is sitting right at a confluence of support and resistance trendlines:
* MACD: Starting to recover after a bearish dip, showing early signs of momentum turning back positive.
* Stoch RSI: Pushing back toward overbought, suggesting buyers are regaining control, but overextension risk remains.
* Key Levels: Support sits at $603–602.9, with a deeper floor at $600. Resistance is overhead at $608–610, aligning with the wedge breakout zone.
Intraday takeaway: QQQ is set for a decisive move. Above $608, it could press into $610+, but losing $603 risks a flush back into $600.
Options Sentiment & GEX Outlook (1H Chart)
Gamma exposure highlights a clear battleground for tomorrow’s session:
* Gamma Walls:
* $606–608: Major call resistance cluster and highest positive GEX zone.
* $600: Gamma pivot and HVL level — critical support where dealers may defend.
* $595–590: Heavy put walls below, acting as downside magnets if $600 breaks.
* Implications:
* Holding above $603–606 keeps price magnetized toward $608–610.
* A breakdown under $600 would trigger dealer hedging pressure, driving the Qs toward $595–590.
* Volatility Context: IVR at 17.8 is low, while options positioning skews bearish with 44.8% puts. This suggests traders are hedged defensively, which could amplify a sharp move either way.
My Thoughts & Recommendation
For Oct 3 trading, QQQ is boxed into a gamma range with clear pivot levels:
* Intraday (scalping/trading): Favor longs above $606, aiming for $608–610 breakout. Shorts become attractive on rejections near $608 with downside into $603 and $600.
* Options trading (swing/0DTE): Calls only make sense if QQQ breaks $608 with volume, targeting $610+. If QQQ loses $603 and especially $600, puts toward $595 offer better risk/reward.
Bias heading into Oct 3: Neutral with breakout potential — $608 is the level that decides.
Disclaimer: This analysis is for educational purposes only and does not constitute financial advice. Always do your own research and manage risk before trading.
Exención de responsabilidad
La información y las publicaciones que ofrecemos, no implican ni constituyen un asesoramiento financiero, ni de inversión, trading o cualquier otro tipo de consejo o recomendación emitida o respaldada por TradingView. Puede obtener información adicional en las Condiciones de uso.