📉 NVIDIA Daily Chart Correction – Elliott Wave Insight
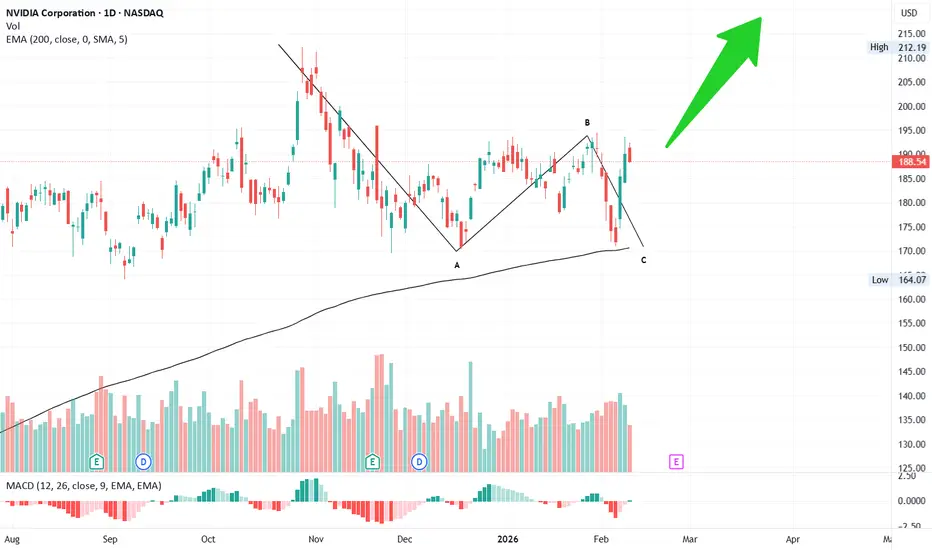
NVIDIA began its correction on 29 Oct ’25, topping at 212. From there, it declined sharply to 170 by 17 Dec ’25, completing the A wave.
📊 The A wave unfolded in 5 sub-waves, signaling a zig-zag correction pattern.
📈 As expected, the B wave retraced less than the 61.8% Fibonacci level, peaking at 197 on 29 Jan ’26.
💥 The C wave followed with a sharp downfall, finally completing on 5 Feb ’26 right at the 200 EMA on the daily chart.
🎯 Looking ahead, the next target sits at 220, aligning with the broader corrective structure and Fibonacci projections.
⚡ This sequence highlights the precision of Elliott Wave theory in capturing market psychology and corrective structures.
#Trading 📉 #ElliottWave 📊 #NVIDIA 💹 #TechnicalAnalysis 📈 #StockMarketInsights 💵 #Target 🎯 #Stocks 📊 #Investing 💼 #Charts 🖊️ #MarketTrends 📊
Publicaciones relacionadas
Exención de responsabilidad
La información y las publicaciones no constituyen, ni deben considerarse como asesoramiento o recomendaciones financieras, de inversión, de trading o de otro tipo proporcionadas o respaldadas por TradingView. Más información en Condiciones de uso.