### **Recent Price Performance**
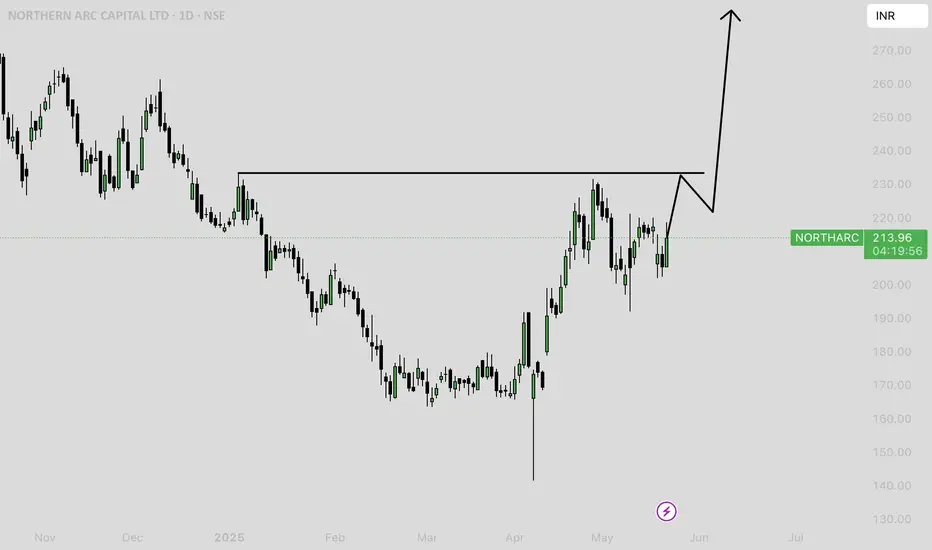
- **Current Price:** As of the latest available data, Northern Arc Capital Ltd (NORTHARC) is trading around ₹208–213.
- **Volatility:** The stock is showing a volatility of about 4.14% with a beta of 1.37, indicating higher-than-market volatility.
- **52-Week Range:** The price has ranged from a low of ₹141.47 (April 7, 2025) to a high of ₹350.00 (September 24, 2024).
- **Recent Trend:** NORTHARC has fallen by about 8% over the past week but is up nearly 14% over the past month. Over the last year, the stock is down 39% from its highs.
### **Technical Indicators**
#### **Moving Averages**
- **Short-term (20-day EMA/SMA):** Price is near or slightly below the 20-day EMA (₹201.94) and SMA (₹201.11), both indicating a neutral trend.
- **Medium-term (50-day EMA/SMA):** The price is below the 50-day EMA (₹216.61) and SMA (₹218.06), also signaling a neutral to weak trend.
#### **Oscillators**
- **RSI (14):** 34.43, indicating a downtrend and approaching oversold territory[5].
- **Stochastic RSI (14):** 0.41, signaling a strong downtrend.
- **CCI (14):** -97.09, also confirming a downtrend[5].
- **MFI:** 25.56, suggesting strong selling pressure and a strong downtrend.
#### **Support and Resistance Levels**
- **Immediate Support:** ₹188.54
- **Key Support:** ₹185.85, ₹181.19
- **Immediate Resistance:** ₹195.89
- **Next Resistance:** ₹200.55, ₹203.24
- **Pivot Level:** ₹193.2
### **Order Book and Liquidity**
- **Order Book:** There is active buying interest around ₹207–208 and selling interest around ₹210–215, indicating a tight trading range and liquidity at current levels.
- **Volume:** Trading volume is robust, with recent daily volumes exceeding 1.6 million shares.
### **Fundamental and Event Context**
- **Recent One-Time Provision:** NORTHARC recorded a significant one-time provision (impairment of ₹1,200 crore) in Q4 FY25, sharply reducing reported profits. Excluding this, underlying business performance was strong, and some analysts expect a rebound in the coming months.
- **Valuation:** The stock is trading at a price-to-book (P/B) ratio of 1.02 and a trailing P/E of 9.49, both below the sector average, suggesting attractive valuations if underlying fundamentals remain stable.
### **Technical Summary**
- **Overall Technical Rating:** Mixed signals. Moving averages are neutral, but oscillators indicate a downtrend and possible oversold conditions.
- **Short-Term Outlook:** The stock is near key support levels, with oscillators hinting at potential for a technical bounce if selling pressure abates. However, sustained weakness below ₹188 could trigger further downside.
- **Medium-Term Outlook:** Recovery potential exists if the stock holds above support and market absorbs the impact of the one-time provision.
---
**In summary:** NORTHARC is currently consolidating near its recent lows, with technical oscillators in a downtrend but approaching oversold territory. The price is below key moving averages, and significant support exists around ₹185–188. The stock may see a technical bounce if support holds, but further downside is possible if it breaks below these levels. The impact of the recent one-time provision is a key factor, with some market participants expecting a rebound as fundamentals normalize.
Exención de responsabilidad
La información y las publicaciones que ofrecemos, no implican ni constituyen un asesoramiento financiero, ni de inversión, trading o cualquier otro tipo de consejo o recomendación emitida o respaldada por TradingView. Puede obtener información adicional en las Condiciones de uso.