We are in middle of week and Wednesday market trading hours are going to close soon.
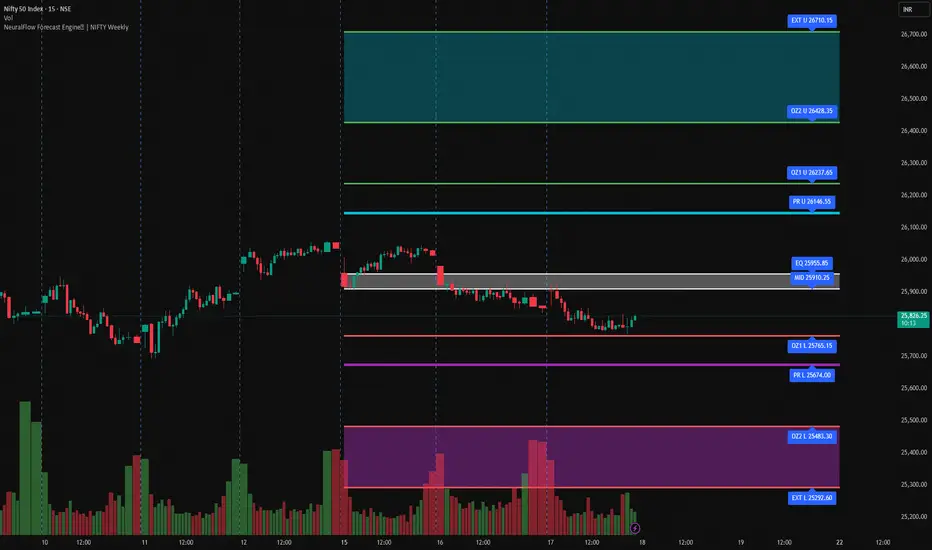
This chart shows weekly NeuralFlow AI bands plotted on a 15-minute NIFTY chart. These are contextual levels, not signals, designed to define where price matters as the week progresses.
By Wednesday, market behavior around these levels usually sets the tone for Thursday–Friday.
What These AI Bands Measure
The NeuralFlow Forecast Engine™ is a proprietary Artificial Intelligence framework trained to identify rebalancing zones, not breakout targets. It maps auction behavior, not trader sentiment.
The bands highlight:
.................................................................................................................
Key Weekly AI Levels (This Week)
Upper Structure
Predictive Rail (Upper): 26,146
Outer / Extreme Upper Zone: 26,400 – 26,700
Balance
AI Equilibrium: 25,955
Mid-Equilibrium: 25,910
Lower Structure
Outer Lower Zone: 25,483
Extreme Lower Zone: 25,293
Please NOTE: These are weekly reference levels, not intraday targets.
.............................................................................................................
Mid-Week Read (Wednesday)
Earlier this week, NIFTY moved above equilibrium (25,955) but failed to hold.
Price has since:
Rotated back below equilibrium
Stabilized in the lower half of the weekly range
Shown controlled selling, not panic
This suggests value is shifting lower, not a trending breakdown.
...............................................................................................................
How to Use These Levels
Below Equilibrium (Below 25,955)
Middle of the Range (25,700–25,900 approx.)
Lower Zones (25,483 → 25,293)
These zones often produce end-of-week responses.
What Would Change the Structure?
Acceptance above 25,955
→ Balance restored, longs regain edge
Acceptance below 25,483
→ Downside discovery toward lower extremes
Rejection from 25,293–25,483
→ Likely rotation higher, not trend reversal
Acceptance means holding, not just touching.
................................................................................................................
Thursday–Friday Playbook
Below 25,955
→ Prefer selling rallies
→ Avoid chasing upside moves
Above 25,955 with acceptance
→ Shorts lose edge
→ Upside rotations toward 26,146 possible
Near 25,483–25,293
→ Reduce shorts
→ Watch for bounce or range formation
Final Takeaway
NIFTY has:
Tested fair value at 25,955
Failed to accept it
Settled lower in the weekly structure
................................................................................................................
The goal is not prediction.The goal is trading only at meaningful levels.
Wait for price to reach where risk makes sense. Everything else is noise.
Happy trading!
This chart shows weekly NeuralFlow AI bands plotted on a 15-minute NIFTY chart. These are contextual levels, not signals, designed to define where price matters as the week progresses.
By Wednesday, market behavior around these levels usually sets the tone for Thursday–Friday.
What These AI Bands Measure
The NeuralFlow Forecast Engine™ is a proprietary Artificial Intelligence framework trained to identify rebalancing zones, not breakout targets. It maps auction behavior, not trader sentiment.
The bands highlight:
- Where price prefers to stabilize
- Where expansion starts losing strength
- Where moves historically exhaust
.................................................................................................................
Key Weekly AI Levels (This Week)
Upper Structure
Predictive Rail (Upper): 26,146
Outer / Extreme Upper Zone: 26,400 – 26,700
Balance
AI Equilibrium: 25,955
Mid-Equilibrium: 25,910
Lower Structure
Outer Lower Zone: 25,483
Extreme Lower Zone: 25,293
Please NOTE: These are weekly reference levels, not intraday targets.
.............................................................................................................
Mid-Week Read (Wednesday)
Earlier this week, NIFTY moved above equilibrium (25,955) but failed to hold.
Price has since:
Rotated back below equilibrium
Stabilized in the lower half of the weekly range
Shown controlled selling, not panic
This suggests value is shifting lower, not a trending breakdown.
...............................................................................................................
How to Use These Levels
Below Equilibrium (Below 25,955)
- Long trades have lower probability
- Rallies toward 25,955–26,146 are corrective
- Prefer sell-on-rallies, not breakout longs
Middle of the Range (25,700–25,900 approx.)
- Choppy price action
- High stop-loss risk
- Avoid trading here
Lower Zones (25,483 → 25,293)
- Risk becomes better defined
- Avoid fresh shorts into these levels
- Watch for slowing momentum or rejection
These zones often produce end-of-week responses.
What Would Change the Structure?
Acceptance above 25,955
→ Balance restored, longs regain edge
Acceptance below 25,483
→ Downside discovery toward lower extremes
Rejection from 25,293–25,483
→ Likely rotation higher, not trend reversal
Acceptance means holding, not just touching.
................................................................................................................
Thursday–Friday Playbook
Below 25,955
→ Prefer selling rallies
→ Avoid chasing upside moves
Above 25,955 with acceptance
→ Shorts lose edge
→ Upside rotations toward 26,146 possible
Near 25,483–25,293
→ Reduce shorts
→ Watch for bounce or range formation
Final Takeaway
NIFTY has:
Tested fair value at 25,955
Failed to accept it
Settled lower in the weekly structure
................................................................................................................
The goal is not prediction.The goal is trading only at meaningful levels.
Wait for price to reach where risk makes sense. Everything else is noise.
Happy trading!
Nota
Today’s intraday movement respected the weekly NeuralFlow AI structure with precision.Key observations:
Price rallied into mid-equilibrium (25,910) and failed cleanly
Multiple attempts above this level were rejected, confirming it as active value resistance
Price then rotated lower and stabilized near 25,765, aligning with the lower intra-distribution support zone
This behavior confirms a controlled auction, not panic selling or breakout expansion.
Price respected structure on both sides:
Rejection at mid-equilibrium
Stabilization above lower outer zones
AI-driven market structure analysis.
Exención de responsabilidad
La información y las publicaciones no constituyen, ni deben considerarse como asesoramiento o recomendaciones financieras, de inversión, de trading o de otro tipo proporcionadas o respaldadas por TradingView. Más información en Condiciones de uso.