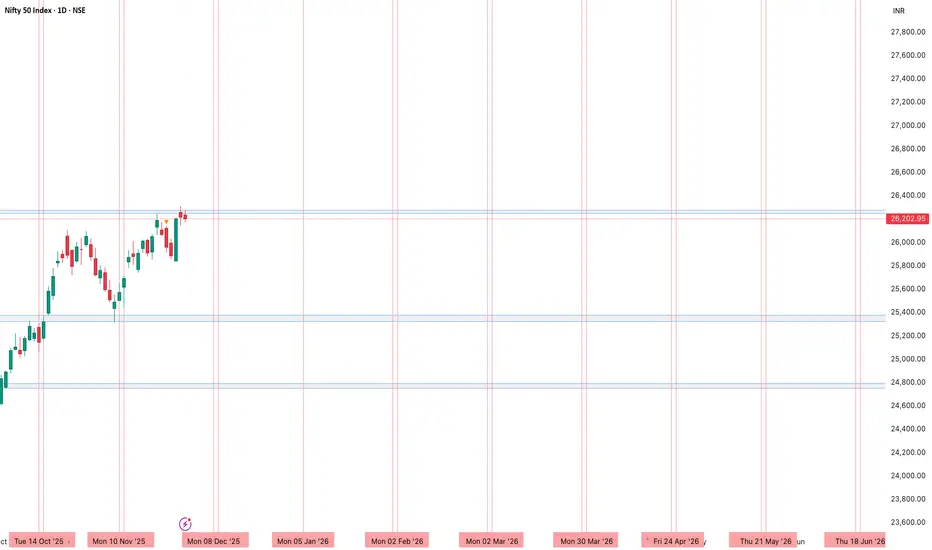
In this analysis, I have marked vertical lines on the Nifty chart based on the 2026 Pushya Nakshatra dates.
Pushya Nakshatra is considered an important time cycle in financial astrology and often aligns with key market turning points.
The vertical red lines highlight potential time-based trend reversal zones. When these time cycles overlap with major supply-demand levels, Nifty commonly reacts with a reversal or strong directional move.
What this Idea Shows
All major Pushya Nakshatra dates for 2026
Possible time-based reversal areas
Confluence with price structure and support–resistance zones
High-probability reversal points when the price meets the cycle date
Trading Approach
Observe price behavior near marked time cycles
Look for reversal candlestick patterns
Combine with supply–demand zones for higher accuracy
Not a buy/sell signal — only time-cycle based market behaviour observation
Conclusion
Pushya Nakshatra often acts as a natural cycle window where Nifty shows momentum shifts.
By combining these dates with technical zones, traders get early indications of potential trend reversals.
Exención de responsabilidad
La información y las publicaciones no constituyen, ni deben considerarse como asesoramiento o recomendaciones financieras, de inversión, de trading o de otro tipo proporcionadas o respaldadas por TradingView. Más información en Condiciones de uso.
Exención de responsabilidad
La información y las publicaciones no constituyen, ni deben considerarse como asesoramiento o recomendaciones financieras, de inversión, de trading o de otro tipo proporcionadas o respaldadas por TradingView. Más información en Condiciones de uso.