MSFT: Pre-Earnings Levels in Focus! 🎯
Disclaimer:
The information provided in this chart is for educational and informational purposes only and should not be considered as investment advice. Trading and investing involve substantial risk and are not suitable for every investor. You should carefully consider your financial situation and consult with a financial advisor before making any investment decisions. The creator of this chart does not guarantee any specific outcome or profit and is not responsible for any losses incurred as a result of using this information. Past performance is not indicative of future results. Use this information at your own risk. This chart has been created for my own improvement in Trading and Investment Analysis. Please do your own analysis before any investments.
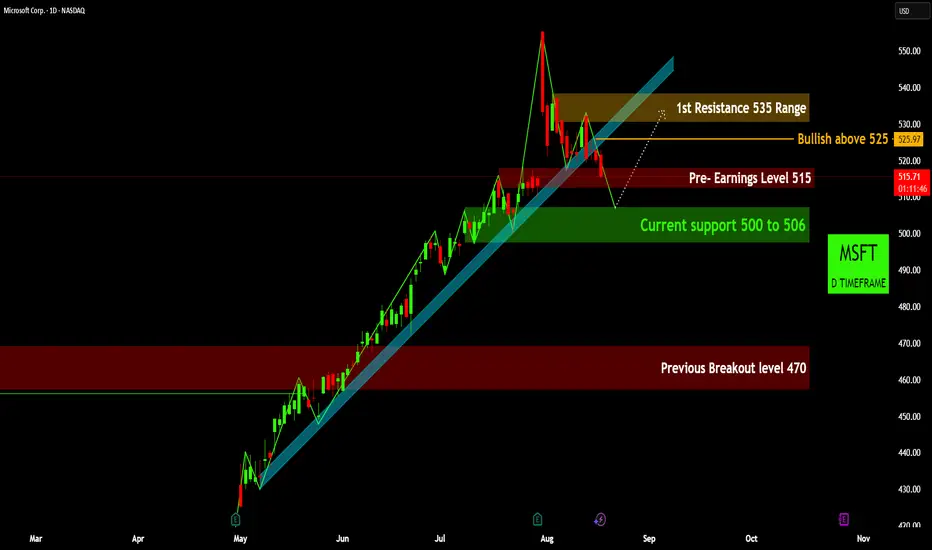
- Microsoft (MSFT) has demonstrated a robust rally since its May lows, establishing a clear bullish trend. The daily chart now highlights critical levels as the stock undergoes a pullback, with the pre-earnings price point acting as an immediate pivot.
- Foundation of the Rally: MSFT's significant uptrend commenced after a decisive breakout above the $470 level 🚀. This breakout provided the foundational momentum for the subsequent strong bullish run.
- Immediate Battleground: Pre-Earnings Level: The stock is currently navigating around the crucial $515 pre-earnings level 💥. This point acts as a near-term pivot; a sustained hold above it would be constructive, while a break below suggests further downside to stronger supports.
- Key Support Zone Ahead: The primary immediate support lies within the 500-506 range 🟢. This zone is critical. A successful bounce from here would confirm underlying strength and offer a potential springboard for a renewed advance.
- Path to Bullish Resumption: For a confirmed bullish continuation, MSFT needs to reclaim and hold above $525 🟡. Beyond this, the first significant resistance awaits in the $535 range 🟠. Overcoming this hurdle is essential for extending gains towards previous highs.
- Strategic Outlook: The overall trend remains bullish. However, current price action demands vigilance at the $515 level. A failure to hold the 500-506 support would indicate a deeper correction ⚠️, potentially testing lower support levels.
Disclaimer:
The information provided in this chart is for educational and informational purposes only and should not be considered as investment advice. Trading and investing involve substantial risk and are not suitable for every investor. You should carefully consider your financial situation and consult with a financial advisor before making any investment decisions. The creator of this chart does not guarantee any specific outcome or profit and is not responsible for any losses incurred as a result of using this information. Past performance is not indicative of future results. Use this information at your own risk. This chart has been created for my own improvement in Trading and Investment Analysis. Please do your own analysis before any investments.
Exención de responsabilidad
La información y las publicaciones que ofrecemos, no implican ni constituyen un asesoramiento financiero, ni de inversión, trading o cualquier otro tipo de consejo o recomendación emitida o respaldada por TradingView. Puede obtener información adicional en las Condiciones de uso.