Volatility, expressed through standard deviation, quantifies market elasticity and presents a level of probability and precision that humbles us all.
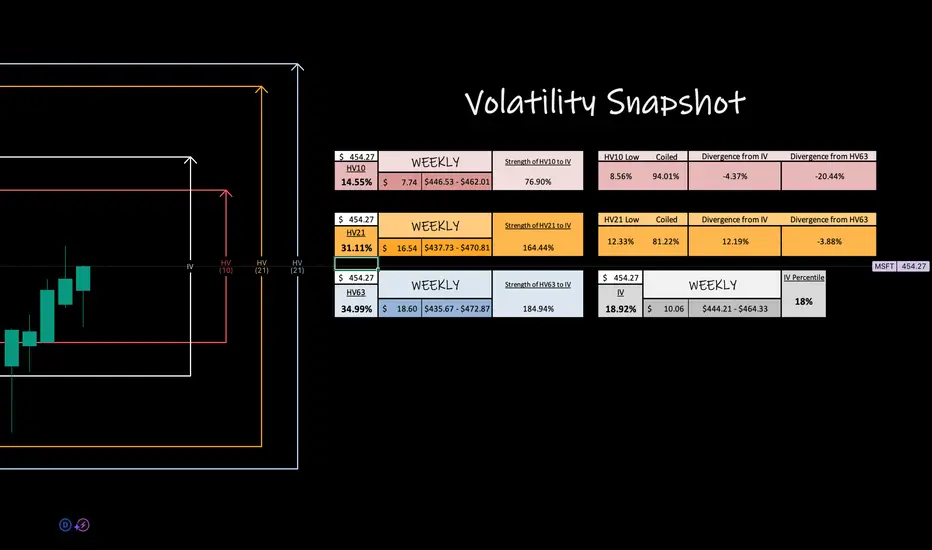
I wanted to take a look at at least one of the magnificent 7s with the community this weekend, so I decided on MSFT because it had the lowest IV of them all.
Lowest IV = best premium value, right? Well it can, but it can also be leading onto more consolidation especially after a big move up likeMSFT has recently done.
Here, we see that HV21 has just come out of it's regression to quarterly means and now is consolidating lower with bi-weekly coiling towards it's yearly lows.
See what I'm doing? Ill be watching for HV21 dropping and HV10 bottoming..there we will find our volatility bounce again. Some of the coolest magic happens when HV10 is at lows at does the HUGE swing back up to quarterly means. SO STAY TUNED!!
BOOST the post, drop a follow and comment, BUT don't forget to circle back at the end of the week to revisit and observe how our trending markets preformed!
I wanted to take a look at at least one of the magnificent 7s with the community this weekend, so I decided on
Lowest IV = best premium value, right? Well it can, but it can also be leading onto more consolidation especially after a big move up like
Here, we see that HV21 has just come out of it's regression to quarterly means and now is consolidating lower with bi-weekly coiling towards it's yearly lows.
See what I'm doing? Ill be watching for HV21 dropping and HV10 bottoming..there we will find our volatility bounce again. Some of the coolest magic happens when HV10 is at lows at does the HUGE swing back up to quarterly means. SO STAY TUNED!!
BOOST the post, drop a follow and comment, BUT don't forget to circle back at the end of the week to revisit and observe how our trending markets preformed!
Operación cerrada manualmente
Happy weekend to everyone in TradingView land!I hope you had a great week. Let’s review what happened with Microsoft —
I had bi-weekly ranges (HV10) inside of stated IV and we did just that. The gap up Monday led to consolidation the rest of the week inside its structure. This should dramatically lower HV10 again into next week. Use the, ‘Grab this Chart’ feature and look over the week visually or use the play back button on the chart to see how the PA unfolded with my volatility ranges.
Dive deeper into the world of volatility with me — Post a comment, ask a question, and BOOST the post if you’d like.
Make sure you 'Grab my Chart' weekly to pull my data onto your screen!
Find me over on the 'X' platform:
@askHVtobidIV
Make sure you 'Grab my Chart' weekly to pull my data onto your screen!
Find me over on the 'X' platform:
@askHVtobidIV
Publicaciones relacionadas
Exención de responsabilidad
La información y las publicaciones que ofrecemos, no implican ni constituyen un asesoramiento financiero, ni de inversión, trading o cualquier otro tipo de consejo o recomendación emitida o respaldada por TradingView. Puede obtener información adicional en las Condiciones de uso.