✅ Forecast vs Reality – MAGIC/USDT (1st July Model Outcome)
On 1st July 2025, I published a proprietary forecast model for MAGIC/USDT, based on my cycle-driven mathematical framework. This model outlined a three-stage market structure:
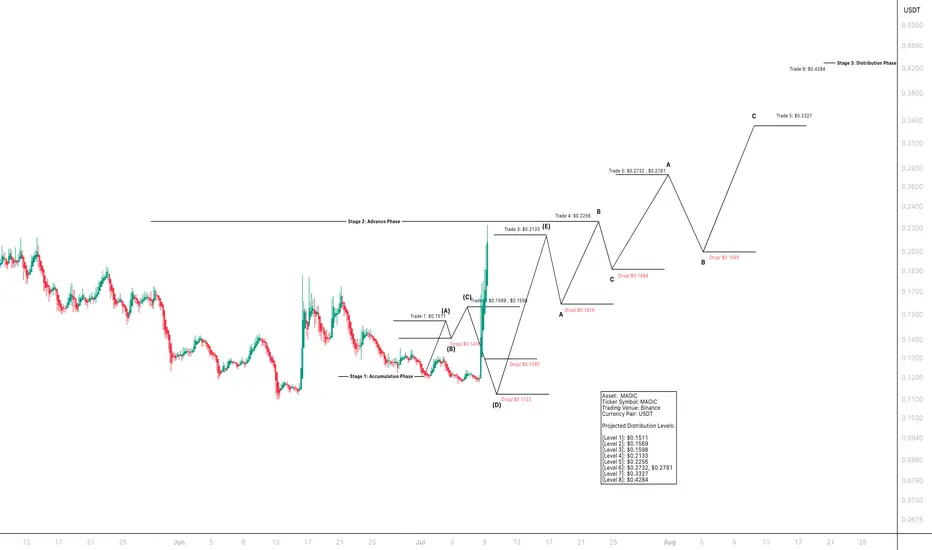
Stage 1: Accumulation Phase
Stage 2: Advance Phase
Stage 3: Distribution Phase
The model projected 8 key distribution levels, identifying both bullish targets and intermediate correction zones.
📊 Forecast Highlights:
Trade Levels Forecasted:
$0.1511 → $0.4284 (Levels 1–8)
Cycle Drops Identified:
$0.1406, $0.1297, $0.1123, $0.1616, $0.1864, $0.1995
Framework: Built on real-time structure using historical repetition, volatility decay, and price-cycle timing.
📈 Market Outcome:
The market followed the projected path with precision, hitting each projected trade level and responding to drop zones nearly identically to the model forecast.
The final distribution level of $0.4284 was achieved marking a complete cycle realisation from accumulation to distribution.

On 1st July 2025, I published a proprietary forecast model for MAGIC/USDT, based on my cycle-driven mathematical framework. This model outlined a three-stage market structure:
Stage 1: Accumulation Phase
Stage 2: Advance Phase
Stage 3: Distribution Phase
The model projected 8 key distribution levels, identifying both bullish targets and intermediate correction zones.
📊 Forecast Highlights:
Trade Levels Forecasted:
$0.1511 → $0.4284 (Levels 1–8)
Cycle Drops Identified:
$0.1406, $0.1297, $0.1123, $0.1616, $0.1864, $0.1995
Framework: Built on real-time structure using historical repetition, volatility decay, and price-cycle timing.
📈 Market Outcome:
The market followed the projected path with precision, hitting each projected trade level and responding to drop zones nearly identically to the model forecast.
The final distribution level of $0.4284 was achieved marking a complete cycle realisation from accumulation to distribution.
Institutional Note:
For institutional review, independent verification, or strategic collaboration:
institutions@bmoses.com.au
For institutional review, independent verification, or strategic collaboration:
institutions@bmoses.com.au
Exención de responsabilidad
La información y las publicaciones que ofrecemos, no implican ni constituyen un asesoramiento financiero, ni de inversión, trading o cualquier otro tipo de consejo o recomendación emitida o respaldada por TradingView. Puede obtener información adicional en las Condiciones de uso.