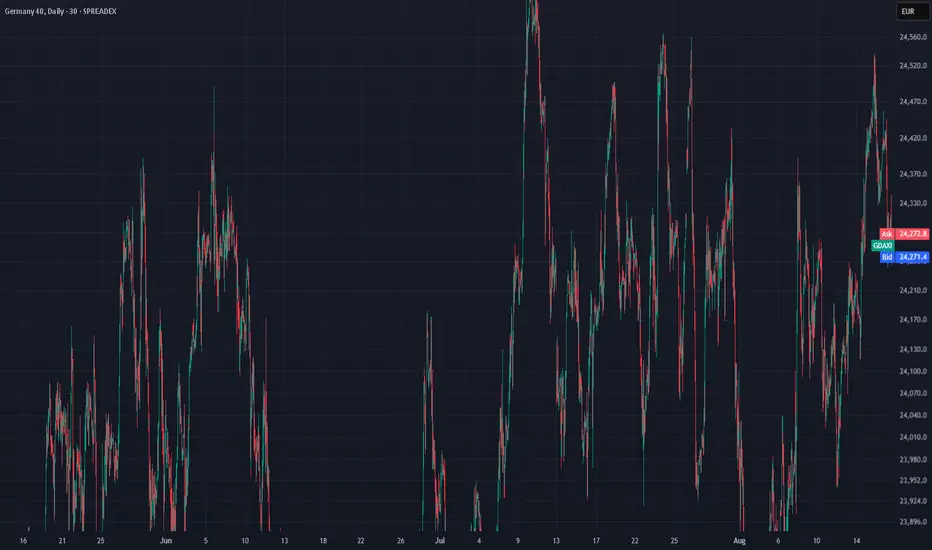
Germany 40 is range-bound at 24,328, near its VWAP of 24,087. RSI at 55 indicates stable momentum. Support is 23,518 while resistance is 24,656.

UK 100 remains bullish but consolidating, trading at 9,140, slightly above VWAP 9,129. RSI at 56 reflects steady upward bias. Support is 9,071, resistance is 9,192.

Wall Street holds a bullish trend but is correcting, last at 44,942 near VWAP 44,364. RSI at 59 leans bullish. Support is 43,434, resistance 45,295.

Brent Crude is still in a choppy range, down to 6,520, now well below VWAP 6,761. RSI at 38 signals bearish momentum. Support stands at 6,283, resistance at 7,238.

Gold remains sideways and in the middle of its large range at 3,337, near VWAP 3,340. RSI at 47 reflects neutral tone. Support is 3,285, resistance 3,415.

EUR/USD has corrected within its uptrend and is now testing the highs, at 1.1675 above VWAP 1.1618. RSI at 53 suggests balanced momentum. Support is 1.1451, resistance 1.1784.

GBP/USD is tracking just below recent highs in a tight pullback, trading at 1.3539 above VWAP 1.3410. RSI at 58 signals bullish momentum. Support is 1.3170, resistance 1.3648.

USD/JPY stays range-bound at 147.87, aligned with VWAP 147.9. RSI at 53 reflects a neutral outlook. Support is 146.00, resistance 149.60.

UK 100 remains bullish but consolidating, trading at 9,140, slightly above VWAP 9,129. RSI at 56 reflects steady upward bias. Support is 9,071, resistance is 9,192.
Wall Street holds a bullish trend but is correcting, last at 44,942 near VWAP 44,364. RSI at 59 leans bullish. Support is 43,434, resistance 45,295.
Brent Crude is still in a choppy range, down to 6,520, now well below VWAP 6,761. RSI at 38 signals bearish momentum. Support stands at 6,283, resistance at 7,238.
Gold remains sideways and in the middle of its large range at 3,337, near VWAP 3,340. RSI at 47 reflects neutral tone. Support is 3,285, resistance 3,415.
EUR/USD has corrected within its uptrend and is now testing the highs, at 1.1675 above VWAP 1.1618. RSI at 53 suggests balanced momentum. Support is 1.1451, resistance 1.1784.
GBP/USD is tracking just below recent highs in a tight pullback, trading at 1.3539 above VWAP 1.3410. RSI at 58 signals bullish momentum. Support is 1.3170, resistance 1.3648.
USD/JPY stays range-bound at 147.87, aligned with VWAP 147.9. RSI at 53 reflects a neutral outlook. Support is 146.00, resistance 149.60.
Get started now
You can now spread bet on TradingView with Spreadex!
Register in just minutes on the website below, link your new Spreadex account to TradingView and begin trading 1000s of global markets.
You can now spread bet on TradingView with Spreadex!
Register in just minutes on the website below, link your new Spreadex account to TradingView and begin trading 1000s of global markets.
Exención de responsabilidad
La información y las publicaciones no pretenden ser, ni constituyen, asesoramiento o recomendaciones financieras, de inversión, de trading o de otro tipo proporcionadas o respaldadas por TradingView. Más información en Condiciones de uso.