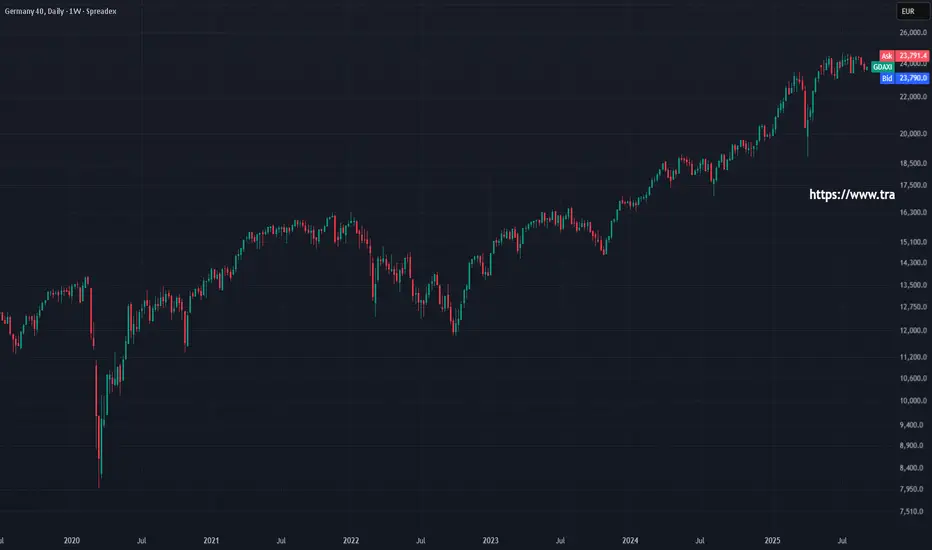
Germany 40 remains range-bound at 23,751, trading under its VWAP of 24,029. RSI at 42 signals weaker momentum. Support at 23,455 is being tested while resistance is 24,604.

UK 100 remains bullish but has pulled back from recent highs down to its VWAP, trading at 9,224. RSI at 54 shows neutral-to-positive momentum. Support is 9,097, resistance is 9,347.

Wall Street continues in a bullish trend, consolidating below record highs, last at 45,487 above its VWAP of 45,243. RSI at 58 leans bullish. Support is 44,684, resistance 45,803.

Brent Crude is still in a choppy range, at 6,654 the price is hovering around its VWAP of 6,690. RSI at 47 reflects neutral momentum. Support stands at 6,492, resistance at 6,888.

Gold has surged higher, trading at new record highs, currently 3,612 above VWAP 3,570 and breaking out of its multi-month consolidation. RSI at 80 indicates strong bullish momentum. Support is 3,400, resistance 3,796.

EUR/USD is pushing towards recent highs and a possible triangle breakout, trading at 1.1726 around VWAP 1.1726. RSI at 56 suggests balanced-to-bullish momentum. Support is 1.1652, resistance 1.1796.

GBP/USD is still in an extended correction within a bullish trend, trading at 1.3510 near VWAP 1.3485. RSI at 53 signals steady momentum. Support is 1.3398, resistance is 1.3573.

USD/JPY stays range-bound at 147.71 stalling after a triangle breakout, now just above the VWAP at 147.12. RSI at 51 reflects a neutral outlook. Support is 146.53, resistance 148.66.

UK 100 remains bullish but has pulled back from recent highs down to its VWAP, trading at 9,224. RSI at 54 shows neutral-to-positive momentum. Support is 9,097, resistance is 9,347.
Wall Street continues in a bullish trend, consolidating below record highs, last at 45,487 above its VWAP of 45,243. RSI at 58 leans bullish. Support is 44,684, resistance 45,803.
Brent Crude is still in a choppy range, at 6,654 the price is hovering around its VWAP of 6,690. RSI at 47 reflects neutral momentum. Support stands at 6,492, resistance at 6,888.
Gold has surged higher, trading at new record highs, currently 3,612 above VWAP 3,570 and breaking out of its multi-month consolidation. RSI at 80 indicates strong bullish momentum. Support is 3,400, resistance 3,796.
EUR/USD is pushing towards recent highs and a possible triangle breakout, trading at 1.1726 around VWAP 1.1726. RSI at 56 suggests balanced-to-bullish momentum. Support is 1.1652, resistance 1.1796.
GBP/USD is still in an extended correction within a bullish trend, trading at 1.3510 near VWAP 1.3485. RSI at 53 signals steady momentum. Support is 1.3398, resistance is 1.3573.
USD/JPY stays range-bound at 147.71 stalling after a triangle breakout, now just above the VWAP at 147.12. RSI at 51 reflects a neutral outlook. Support is 146.53, resistance 148.66.
Get started now
You can now spread bet on TradingView with Spreadex!
Register in just minutes on the website below, link your new Spreadex account to TradingView and begin trading 1000s of global markets.
You can now spread bet on TradingView with Spreadex!
Register in just minutes on the website below, link your new Spreadex account to TradingView and begin trading 1000s of global markets.
Exención de responsabilidad
La información y las publicaciones no constituyen, ni deben considerarse como asesoramiento o recomendaciones financieras, de inversión, de trading o de otro tipo proporcionadas o respaldadas por TradingView. Más información en Condiciones de uso.