This script is a visual aid for my personal testing of a systematic trading plan. It is designed to help me manually identify and mark key structural components on the chart. The core concepts I am testing are Trading Ranges, Inducement Levels, and Points of Interest (POI), specifically Order Flows and Order Blocks. (On this chart, an Order Flow)
This is a work in progress and represents my personal learning process. It is not intended as financial advice or a complete trading system.
Key Features I am Testing:
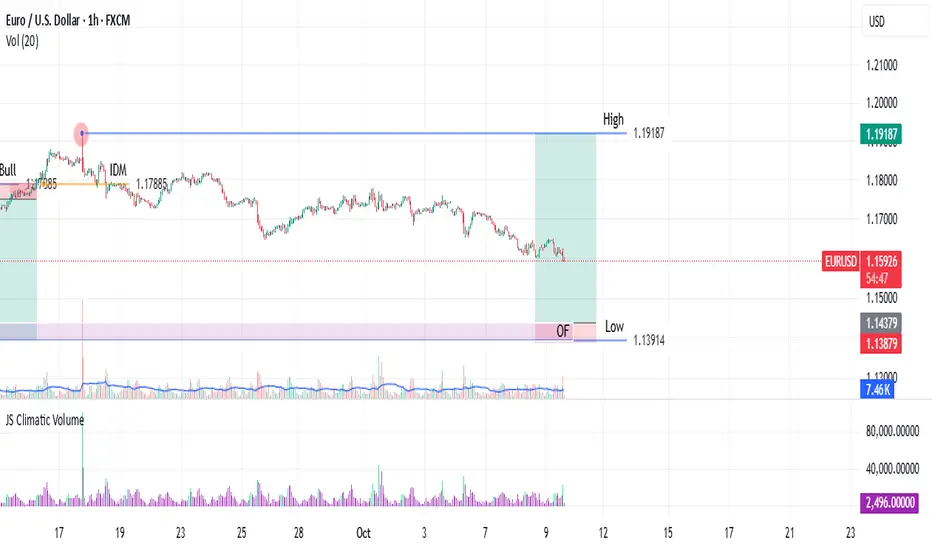
Trading Range Identification: The script helps mark the high and low of a defined trading range, which I identify based on a confirmed break of structure or change of character. In this case what is depicted is a change of character from Bearish to Bullish Sentiment on the EURUSD One-Hour Frame.
Inducement Visualization: It allows for the marking of key inducement levels. In my testing, an inducement is the pullback high (in a bearish move) or low (in a bullish move) immediately preceding the most recent significant low or high. A range is considered valid once its corresponding inducement is traded through.
Order Flow/Block Marking: The tool assists in highlighting potential OFs or OBs. These ranges or candles, located near range extremes, are the Points of Interest I test for potential entries.
My Testing Notes & Disclaimer:
This visual tool is part of my journaling process to build discipline and consistency. I use it to document my hypothesis for each trade setup. The market does not always respect these levels, and a key part of my testing is learning to distinguish between valid and invalid POIs.
My risk management rules are separate and non-negotiable. I always define my stop loss and position size before entering any test trade.
I am sharing this as a documentation of my own testing framework, not as a recommendation.
This is a work in progress and represents my personal learning process. It is not intended as financial advice or a complete trading system.
Key Features I am Testing:
Trading Range Identification: The script helps mark the high and low of a defined trading range, which I identify based on a confirmed break of structure or change of character. In this case what is depicted is a change of character from Bearish to Bullish Sentiment on the EURUSD One-Hour Frame.
Inducement Visualization: It allows for the marking of key inducement levels. In my testing, an inducement is the pullback high (in a bearish move) or low (in a bullish move) immediately preceding the most recent significant low or high. A range is considered valid once its corresponding inducement is traded through.
Order Flow/Block Marking: The tool assists in highlighting potential OFs or OBs. These ranges or candles, located near range extremes, are the Points of Interest I test for potential entries.
My Testing Notes & Disclaimer:
This visual tool is part of my journaling process to build discipline and consistency. I use it to document my hypothesis for each trade setup. The market does not always respect these levels, and a key part of my testing is learning to distinguish between valid and invalid POIs.
My risk management rules are separate and non-negotiable. I always define my stop loss and position size before entering any test trade.
I am sharing this as a documentation of my own testing framework, not as a recommendation.
Publicaciones relacionadas
Exención de responsabilidad
La información y las publicaciones no constituyen, ni deben considerarse como asesoramiento o recomendaciones financieras, de inversión, de trading o de otro tipo proporcionadas o respaldadas por TradingView. Más información en Condiciones de uso.