** forecast to print in the next 60 days at most **
45% return after 4 years, that is what fans of Ethereum will rejoice over once the forecast to $6.6k is met. 45%, what a tremendous consumption of time and energy for such a insignificant return. A return that is largely evaporated when inflation is factored in. By comparison Gold as printed 100% return since and Ethereum 0%
The argument foundations
Complete alt token collapse?
40 days until Bear market?
$6.6k Maybe $7k, and then the death of Ethereum
Conclusion - What does all mean for the crypto market in the years ahead?
This is best kept for another post. Essentially the Crypto currency asset class is a “Growth sector”, which is a description of assets people chase because they believe they’ll grow in the future. It has nothing to do with ability to generate income on merit or to provide a useful function in society. After 10 years of following this space, there’s not been no meaningful value proposition offered. Just clever marketing and eye candy. The Crypto currency asset class is about to have its Dot.com moment.
Ww
45% return after 4 years, that is what fans of Ethereum will rejoice over once the forecast to $6.6k is met. 45%, what a tremendous consumption of time and energy for such a insignificant return. A return that is largely evaporated when inflation is factored in. By comparison Gold as printed 100% return since and Ethereum 0%
The argument foundations
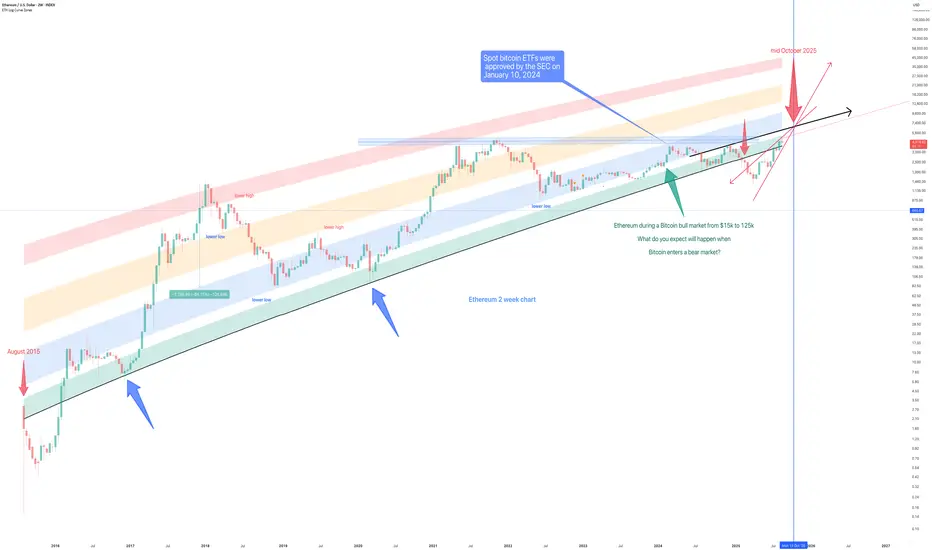
The much hyped Bitcoin ETF was said to start a liquidity rush into other assets. No such thing ever happened, it was a liquidity trap, not a catapult. The folks using Bitcoin ETFs today have no interest in selling gains for transfer into Ethereum, You’d be lucky if the majority of ETF users knew what a Bitcoin address looked like.
From the market lows of November 2022 Bitcoin has returned 700% until 125k. Ethereum during the same period, 300%.
In previous cycles Ethereum achieved 18,000% in 2017 and 5000% in 2021 as fresh Bitcoin liquidity entered the market. By early 2024 the Bitcoin ETF was introduced, removing any opportunity of fresh liquidity flowing into Ethereum as in previous cycles. The recent idea on the OTHERS market total asked the question “Is alt season dead?”, clearly yes. There was never going to be an alt token season in this cycle with the ETF introduction and regulation success afforded to Bitcoin. If you wanted risk exposure to Crypto, you bought Bitcoin. Everything else was a regulation nightmare.
An alt token season typically requires 3 months minimum. This current cycle has around 40 days until completion. Unless this time is different, the halving cycles since the start of Bitcoin has with pin point accuracy informed the market when the top was in. See below.
Complete alt token collapse?
Yes. The signal to cause millions of tokens in circulation to drop to oblivion will be a signal from Ethereum itself. If Ethereum could not match the performance of Bitcoin’s bull market then one must ask, how fair Ethereum in a Bitcoin bear market that begins in a little over 40 days?
40 days until Bear market?
40 days remain of this bull market. That’s it. 40 days and 40 nights as influencers gaslight their audiences with prophecy of $10k and beyond come quarter 4, October through December. However the chart tells us the outlook is very different.
The Halving cycle and market top can be measured with pinpoint precision since the inception of Bitcoin itself. To ignore those facts is emotional.
Notice each following cycle the market is weaker than the previous. The entire crypto space is preparing to enter a period of complete collapse and irrelevance. A collapse that will be felt most painfully with Ethereum as so many have been led to believe it is the next thing. Influencers talk of institutional acquisition leading investors allocate pension exposure. What a nightmare the other side will be.
$6.6k Maybe $7k, and then the death of Ethereum
The entire history of Ethereum price action is shown on the above 2 week chart. This is a log growth curve chart. As the name suggests, it is a chart that tells you if an asset is in growth or decline.
Ethereum has been in growth for 10 years exactly. Look left, red arrows. That growth has enjoyed support (blue arrows) until a price action breakout on February 2025. The breakout now seeks to confirm resistance, which is around $6.6k to $7k. We can even see a bearish rising wedge pattern form as price action approaches the legacy support.
It is note worthy to see the apex of the rising wedge matches with the expected Bitcoin cycle top. Dazzled? You should be, this is many hours of study.
Conclusion - What does all mean for the crypto market in the years ahead?
This is best kept for another post. Essentially the Crypto currency asset class is a “Growth sector”, which is a description of assets people chase because they believe they’ll grow in the future. It has nothing to do with ability to generate income on merit or to provide a useful function in society. After 10 years of following this space, there’s not been no meaningful value proposition offered. Just clever marketing and eye candy. The Crypto currency asset class is about to have its Dot.com moment.
Ww
Nota
Long entries from 3800 until market top in 40'ish days.Nota
Remember on long entry area mentioned above, let the market come to you. Despite bullish messages participants need to accept there is far more sellers of Ethereum out there than there is buyers.Nota
circa +30% or $2k more upside before a collapse straight down to $2k Operación activa
Remember, $6.6k to 6.8k will be the area of the market top. This happens before the end of October.After that a new bear market.
Nota
If we zoom in we can see a perfect "double top" at this time. A confirmation would be price action closing the month below $4k.This market is inherently weak as Bitcoin approaches its cycle top, if not already.
Nota
Early in this post it was said "Long entries from 3800 until market top in 40'ish days."Start the 40 day countdown as 3800 strikes. Had thought it would be sooner than now, alas.
If 3800 fails, it is likely a visit to 2400 is made before the last hurrah.
If you're using my tools, best wait for a new long signal.
4 day chart
Nota
3800 strike on the nose, longs are good to go now until the market top.Nota
Please ignore "Start the 40 day countdown as 3800 strikes."That was a typo. Cannot edit ideas once published.
Nota
Ethereum Bulls, this is importantIt is entirely possible the $6600 area is not met before the Bitcoin market top. The two week chart below would offer strong historical resistance should it confirm. Whilst influencers are pumping out the “Institutions are buying” narrative, the chart is telling a very different story.

Look closer, notice the 2 week Gravestone DOJI candle? Should this print as is by Monday 13th and confirm on October 27th.. then expect a strong correction, towards $1500 to begin with.
Do not mistake the downward pressure this candle will exert on price action should it print.
Nota
"What would it take to void this idea?"Great question with a simple answer!
If you see a resistance breakout of $4800 AND .. this bit is important, a 2 week candle body close (ignore wicks) on or above $5000, then this idea is void. That is what needs to happen.
If that happens, well you're in for a treat. Price action shall continue to rally until $14k, the cycle top.
If you've been shaken by events over the last 24hr, the best course of action is to do nothing. Do not act until confirmation.
Nota
A few messages on this idea.. Yes, the idea is still active. $6.5k area remains the market top.Long entries from current price action to 3800 if the market offers it.
Nota
Price action prints a significant rejection, with the month of November now closed. A double top in price action is all too clear to see, the growth curve has now offer 2x rejection. How do you ignore and remain bullish?If the bulls are unable to move price action back over $4k, then my long term forecast for $700 area has a high probability of being met.
2 week
Exención de responsabilidad
La información y las publicaciones no constituyen, ni deben considerarse como asesoramiento o recomendaciones financieras, de inversión, de trading o de otro tipo proporcionadas o respaldadas por TradingView. Más información en Condiciones de uso.
Exención de responsabilidad
La información y las publicaciones no constituyen, ni deben considerarse como asesoramiento o recomendaciones financieras, de inversión, de trading o de otro tipo proporcionadas o respaldadas por TradingView. Más información en Condiciones de uso.