1. Big Picture & Market Context
2. Multi-Timeframe Technical Snapshot
3. Elliott Wave & Harmonic Perspective
4. Key Support & Resistance Levels
5. Gann & Wyckoff Analysis
6. Intraday Trading Strategy (5M-1H Charts)
Bullish Scenario (Long):
Bearish Scenario (Short):
7. Swing Trading Strategy (4H-Daily Charts)
Swing Long:
Swing Short:
8. Indicator Cluster Consensus
Disclaimer: This is technical analysis, not financial advice. Always manage your risk and use stop-loss orders.
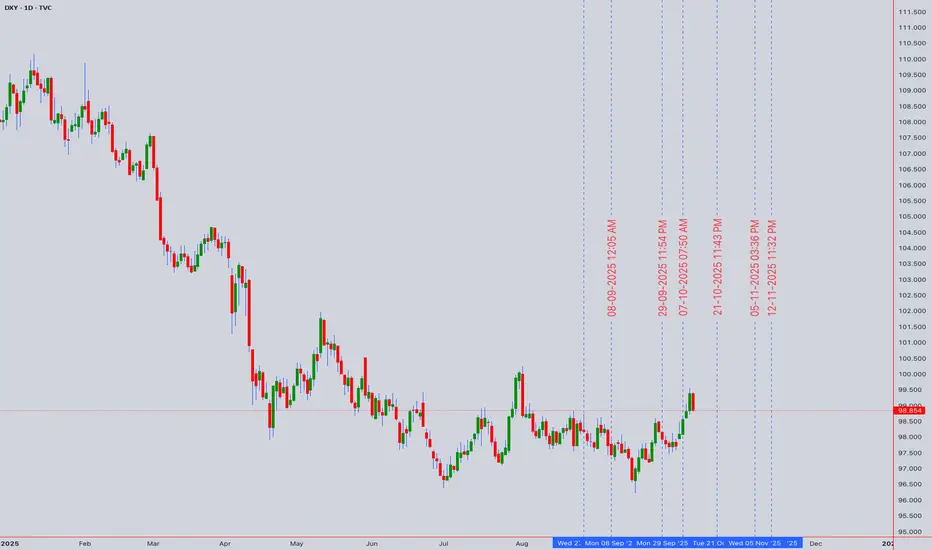
- The DXY is consolidating near a critical technical juncture. Geopolitical tensions and shifting rate expectations continue to be the primary drivers, creating volatility perfect for both intraday scalps and strategic swing positions.
2. Multi-Timeframe Technical Snapshot
- Monthly/Weekly (Swing): Price is squeezed between the 50-week EMA (support ~98.20) and the 200-day SMA (resistance ~99.50). A decisive break either way will set the medium-term trend.
- Daily (Swing & Intraday Bias): The chart shows a potential bearish flag formation following the recent decline. RSI (14) is neutral at 48, offering no extreme bias. The Ichimoku Cloud is thick above price, representing a significant resistance zone.
3. Elliott Wave & Harmonic Perspective
- The pullback from the 100.50 high is being analyzed as either a Wave 4 (corrective) or the start of a larger bearish impulse. The key Harmonic zone for a potential bullish reversal (Bat pattern) lies between 98.30 - 98.50.
4. Key Support & Resistance Levels
- Strong Resistance: 99.50 (200-day SMA & prior swing high)
- Minor Resistance: 99.10 (Intraday)
- Immediate Pivot: 98.85 (Current Price)
- Strong Support: 98.50 (50-week EMA & 50% Fibonacci)
- Critical Support: 98.20 (Breakdown Level)
5. Gann & Wyckoff Analysis
- Gann Square of 9: Key levels align with 98.50 (support) and 99.20 (resistance). A close above 99.20 could trigger a run towards 99.80.
- Wyckoff Cycle: Price action suggests we are in a possible Re-Distribution phase. A failure to hold 98.50 would signal a new Markdown phase, targeting 97.80.
6. Intraday Trading Strategy (5M-1H Charts)
Bullish Scenario (Long):
- Entry: 98.55 - 98.65 (with bullish reversal candlestick confirmation)
- Stop Loss: 98.35
- Take Profit 1: 98.95
- Take Profit 2: 99.15
Bearish Scenario (Short):
- Entry: 99.05 - 99.10 (with bearish rejection confirmation)
- Stop Loss: 99.30
- Take Profit 1: 98.70
- Take Profit 2: 98.50
7. Swing Trading Strategy (4H-Daily Charts)
Swing Long:
- Entry Zone: 98.30 - 98.45 (Accumulation Zone)
- Stop Loss: 97.90 (Daily Close)
- Target 1: 99.20
- Target 2: 99.80
Swing Short:
- Entry Trigger: Daily close below 98.20
- Stop Loss: 98.60
- Target 1: 97.80
- Target 2: 97.20
8. Indicator Cluster Consensus
- Bollinger Bands: Price is trading in the upper band, indicating neutral momentum. A squeeze is forming, signaling a volatility expansion is due.
- Anchored VWAP: (Anchored at last swing high) Price is below VWAP, indicating a Weak Bearish medium-term trend.
- Moving Averages: The 50 EMA is about to cross below the 200 SMA on the 4H chart—a potential "Death Cross" warning for the week ahead.
- Final Verdict: The DXY is at a make-or-break level. The bias is cautiously bearish below 99.10. The 98.50-98.20 zone is critical; a hold there could spark a relief rally, while a break opens the door for a significant swing down.
Disclaimer: This is technical analysis, not financial advice. Always manage your risk and use stop-loss orders.
I am nothing @shunya.trade
Exención de responsabilidad
The information and publications are not meant to be, and do not constitute, financial, investment, trading, or other types of advice or recommendations supplied or endorsed by TradingView. Read more in the Terms of Use.
I am nothing @shunya.trade
Exención de responsabilidad
The information and publications are not meant to be, and do not constitute, financial, investment, trading, or other types of advice or recommendations supplied or endorsed by TradingView. Read more in the Terms of Use.