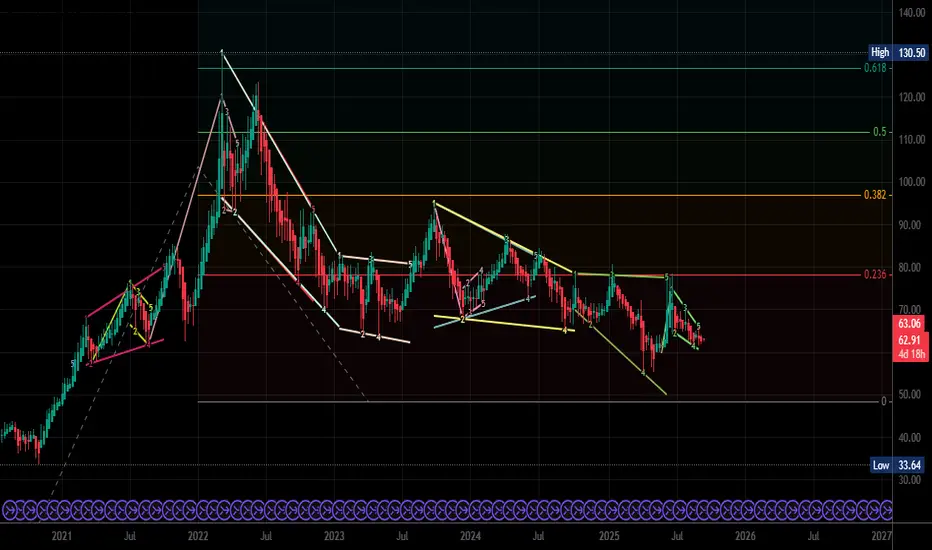
CL1! Weekly — Is today the buy day?
Bullish flag on the weekly, daily CVD higher-low divergence, and a possible monthly 45° (Gann 1×1) reclaim. I’m exploring the long case and mapping what needs to happen.
What I think I’m seeing
Structure: Weekly bull flag compressing under 63.3–64.5.
Flow: Daily CVD made a higher low while price made equal/lower lows → buyers absorbing at the base.
Angle: Price is testing the monthly Gann 1×1 (45°). Reclaim/hold tends to start an advance toward the next fan angles.
Gann breakdown
Horizontal (price resonance)
Trigger band: 63.30–63.40
Guardrails above: 63.56 / 63.63 → 64.24 → 64.49 (convert to support = go mode)
Upside ladder once 64.49 holds: 66.27 → 67.76 → 72.90 → 79.90 → 86.57 → 92.15
Vertical (time)
Watching weekly windows from the last swing low: ~13 / 21 / 34 / 52 weeks (Gann & Fib counts). If a push through 63s–64s aligns with one of these, I’ll weight it higher.
Angle (fan)
A monthly close back above the 1×1 (45°) often points to a rotation toward the 1×2 / 2×1 fans—which line up with the ~66–68 → 72–73 areas on my chart.
Long plan (step-by-step)
Trigger: Push through 63.30–63.40 with CVD printing a higher high versus the prior 2 sessions.
Confirmation steps:
Hold above 63.56 / 63.63
Then 64.24
Promotion to “trend-up” when the daily/4H close > 64.49 and it holds on retest.
Entries (staged):
Buy stop 63.36–63.44
Add on strength 63.58–63.63
Add on successful retest 64.24–64.49
Risk (tight, mechanical):
Initial stop 62.74 (beneath the 0.618/CVD pivot).
After a hold above 64.49, trail under prior day’s low or a rising 1-hr VWAP/EMA.
Targets / scale-outs:
63.97 → 64.49 (convert)
66.27 (first major take-profit)
67.76 (second)
Leave a runner toward 72.90 if the monthly 45° is reclaimed and respected.
Live checklist I’ll monitor
CVD: higher highs on each push through 63.3 / 63.6
VWAP: intraday VWAP rising and respected on dips
Closes: daily/4H > 64.49 and a weekly that keeps 64s as support
Angle: monthly candle tracking above the 45°
I’m treating this as a long setup that needs confirmation: let the tape prove it through 63s → 64.49, then walk the ladder 66.27 → 67.76 → 72.90 with disciplined risk.
Exención de responsabilidad
La información y las publicaciones que ofrecemos, no implican ni constituyen un asesoramiento financiero, ni de inversión, trading o cualquier otro tipo de consejo o recomendación emitida o respaldada por TradingView. Puede obtener información adicional en las Condiciones de uso.