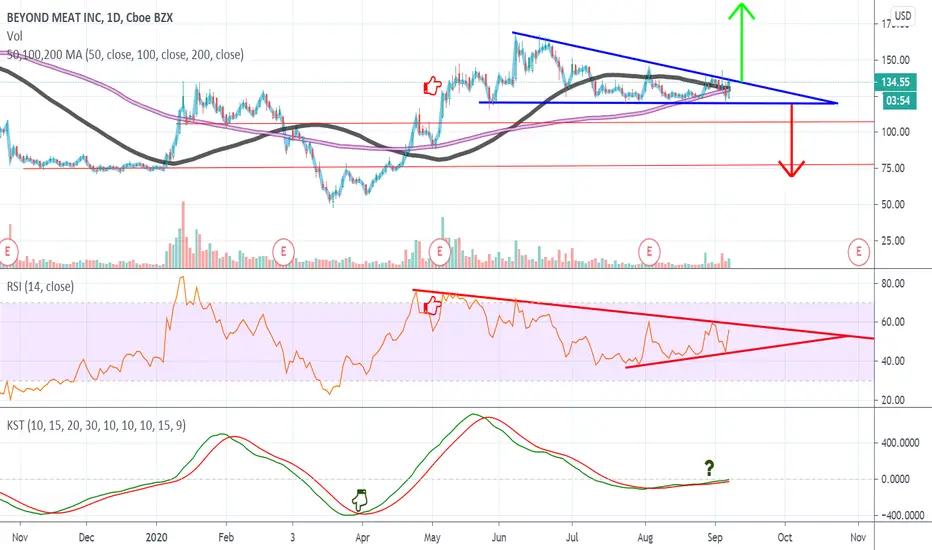
On the RSI there was a noticeable bearish divergence that started in May where I have the red finger pointing sideways, meaning, the price was increasing but the RSI was decreasing, it appears as though the divergence has completed.
On the KST there's potentially a bullish cross happening, I have placed a green finger icon to represent a previous bullish cross, and a question mark to represent where there's one potentially happening now.
On the KST there's potentially a bullish cross happening, I have placed a green finger icon to represent a previous bullish cross, and a question mark to represent where there's one potentially happening now.
Exención de responsabilidad
La información y las publicaciones que ofrecemos, no implican ni constituyen un asesoramiento financiero, ni de inversión, trading o cualquier otro tipo de consejo o recomendación emitida o respaldada por TradingView. Puede obtener información adicional en las Condiciones de uso.