🧭 General Overview
Timeframe: 4H
Asset: USDT-BTC
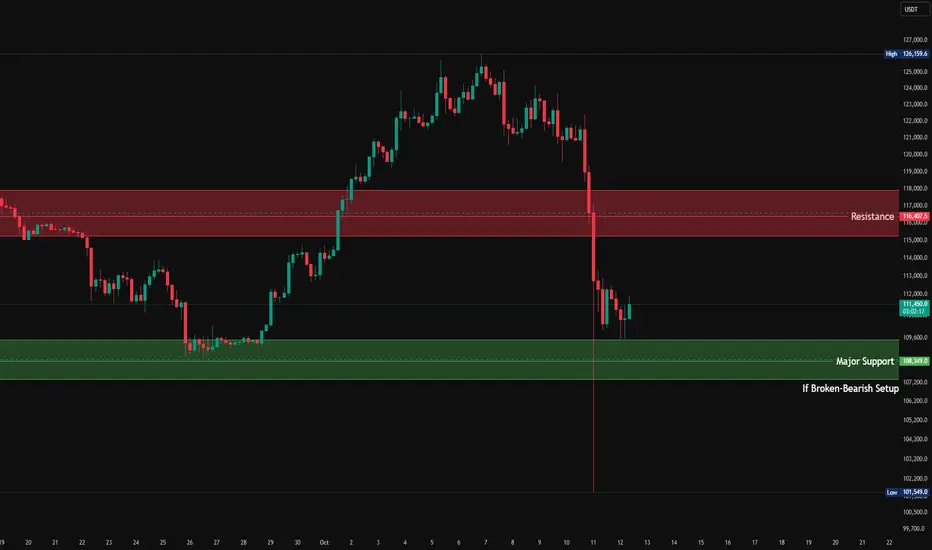
Current Price: ≈ 111,300 USDT
Major Resistance Zone: 116,000–116,400 USDT
Major Support Zone: 108,000–108,350 USDT
Recent High: 126,159 USDT
Recent Low: 101,549 USDT
Price recently rejected from the resistance zone after a strong breakdown, suggesting momentum has turned bearish in the short term.
🧩 Structure & Key Zones
1️⃣ Resistance Zone: 116,000–116,400 USDT
This zone acted as previous support that broke down sharply.
On retest, it now serves as major supply/resistance.
A strong bearish candle initiated from this zone, showing seller dominance.
📉 Expect:
Sellers to re-enter aggressively if price tests this level again.
A lower high formation below 116K = confirmation of short-term bearish bias.
2️⃣ Support Zone: 108,000–108,350 USDT
This is a major demand area, visible from the past bounce.
Price has wicked into it but hasn’t closed below yet — buyers are still defending.
⚠️ If this zone breaks (close below 108K):
Opens room for a deeper correction toward:
106,200 → 103,000 → 101,500 (recent swing low)
📅 Next Week’s Outlook
🔹 Bullish Scenario (Short-Term Relief Rally)
If price holds above 108K and breaks above 112K, we could see:
Short-term bounce toward 114.5K–116K (Resistance Retest)
Watch for rejection candles or weakening momentum there.
Suitable for short-term scalp longs, but risky for swing trades due to strong overhead supply.
🔹 Bearish Scenario (Primary Bias)
Given:
Strong downtrend continuation
Failed recovery attempts
Rejection from prior demand turned supply zone (116K)
If 108K fails, expect:
Acceleration to 105K–102K
Possible overshoot wicks below 101.5K before consolidation or reversal attempt.
Bearish targets for next week (if breakdown occurs):
TP1 → 106,200
TP2 → 103,000
TP3 → 101,500
🕐 Short-Term Perspective (Next 24–72 Hours)
Price is currently consolidating sideways between 111K–108K.
Watch for a range break:
Above 112K → short-term bullish relief
Below 108K → confirmation of bearish continuation
Volume and candle body analysis suggest that sellers are stronger, but buyers are still defending 108K strongly.
🔍 Key Takeaways
The trend is bearish, but we’re at critical support.
Watch 108K closely — it’s the line between correction & collapse.
Any bounce toward 114–116K is likely a sell opportunity.
A breakdown below 108K opens path toward the 100–102K zone.
Exención de responsabilidad
La información y las publicaciones que ofrecemos, no implican ni constituyen un asesoramiento financiero, ni de inversión, trading o cualquier otro tipo de consejo o recomendación emitida o respaldada por TradingView. Puede obtener información adicional en las Condiciones de uso.