Lull In Margin Longs to Begin Liquidation March 16th to 18th
The "position" is labeled "Short" for mid to long term from March 16th or 18th until approximately May 1st before we see another opportunity for a Second Simple Rally in Phase B a couple of months prior to the Litecoin Block Halving.
The title intends to convey I see "potential" for upward pressure today (March 15th) and possibly into tomorrow (March 16th) in an effort to "potentially" lull in margin long positions. Once margin long positions have been lulled into place, they will try to begin liquidating those positions some time between March 16th and 18th. I would not be surprised if they begin sooner around March 16th.
When they do bring us back down to test support for the first time in Phase B, we can expect them to lull in margin short positions AFTER we bounce off support. Meaning, I'm expecting us to go down to support (around $3,300 to $3,500) then come up about $100 to then begin falling again. When we fall again after that bounce, that's where I'm expecting them to lull in margin short positions again in an effort to liquidate them.
Bitcoin History From 2011 to Present Day Using Wyckoff Method:

2012 Accumulation Schematic With Description of each Phase:
2015 Accumulation Schematic With Description of each Phase:
More information about Wyckoff Method can be found here: stockcharts.com...school/doku.php?id=chart_s...
Brief Explanation of Phases A, B, C and D in a Wyckoff Accumulatoin Schematic. Phase E is not covered in this video. Also, do NOT assume I'm saying the Price Action will play out exactly as depicted in the EXAMPLE provided in the video. It's ONLY an example...
We're NOT Bear; We're NOT Bull; We're IN ACCUMULATION.
Word Clarification: Bottom = "BASE" for Purpose of Accumulation.
The title intends to convey I see "potential" for upward pressure today (March 15th) and possibly into tomorrow (March 16th) in an effort to "potentially" lull in margin long positions. Once margin long positions have been lulled into place, they will try to begin liquidating those positions some time between March 16th and 18th. I would not be surprised if they begin sooner around March 16th.
When they do bring us back down to test support for the first time in Phase B, we can expect them to lull in margin short positions AFTER we bounce off support. Meaning, I'm expecting us to go down to support (around $3,300 to $3,500) then come up about $100 to then begin falling again. When we fall again after that bounce, that's where I'm expecting them to lull in margin short positions again in an effort to liquidate them.
Bitcoin History From 2011 to Present Day Using Wyckoff Method:
2012 Accumulation Schematic With Description of each Phase:
2015 Accumulation Schematic With Description of each Phase:
More information about Wyckoff Method can be found here: stockcharts.com...school/doku.php?id=chart_s...
Brief Explanation of Phases A, B, C and D in a Wyckoff Accumulatoin Schematic. Phase E is not covered in this video. Also, do NOT assume I'm saying the Price Action will play out exactly as depicted in the EXAMPLE provided in the video. It's ONLY an example...

We're NOT Bear; We're NOT Bull; We're IN ACCUMULATION.

Word Clarification: Bottom = "BASE" for Purpose of Accumulation.

Comentarios:
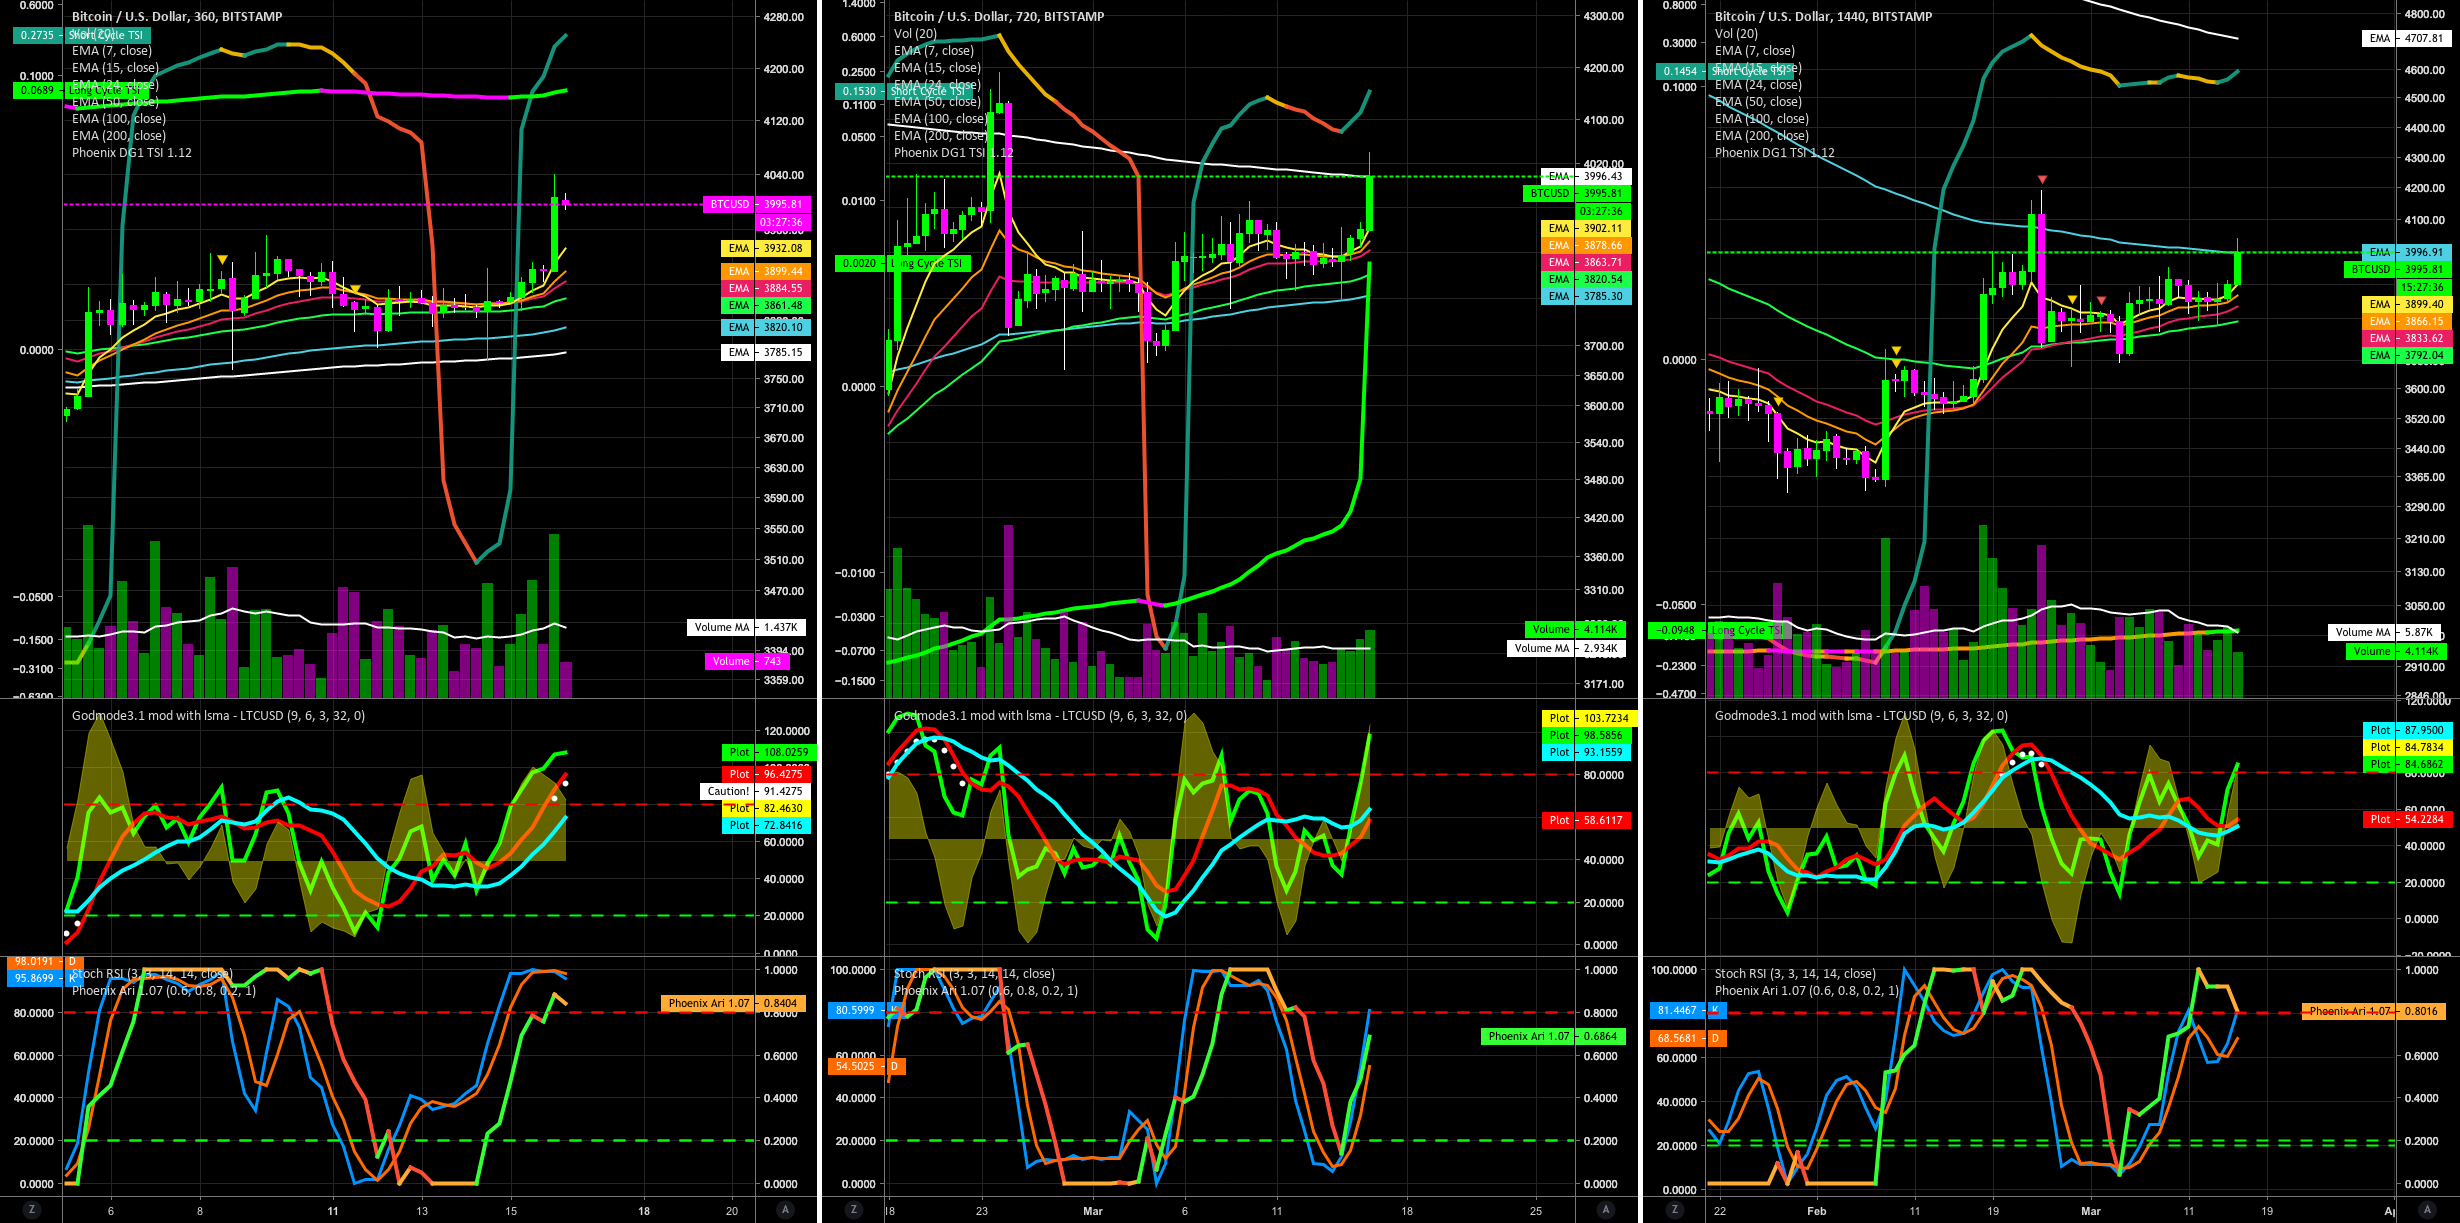
Note the test bubbles for Phoneix TSI Short Cycle indicator in the 3h and 6h time frames.
Comentarios:
A look at the Phoenix TSI Short Cycle in the 3h, 6h and 12h time frames:
Comentarios:
I drew a red line to provide an example of the possible future trek of the Red RSI. The current 8 hour candle has 2 hours remaining before a new 8h candle is created. I see two more 8h candles at the most before we see a reversal to downward pressure. It's POSSIBLE we could make it to the 1.618 FIB at $4,094 but hard to say.