Here's another area many traders struggle with. The real value in using multiple timeframes is to know what to look for and when to look for it!
As I have mentioned in a lot of my posts, all of this comes back to Dow theory; you don't need to make life hard on yourself. instead, simplify your approach and align a small number of timeframes and you will be surprised at the results.
Let me give you an example;

In this image above, you can see a clear push-up and a high, then a pullback.
Why not use this high? It had a clear change of character to the downside.

Well, the answer is - you would view these as separate timeframes. Although they are viewed on the exact same timeframe as my image. One you could call a primary trend and one a secondary.
For a bit more depth, see this post.

If you are already familiar with the idea, then the next thing you want to understand. What phase is the primary trend in?

This becomes important as you drill down to the entry timeframes, as what you are trying to do is to understand a general bias. Once you grasp this, you can even trade the counter-trend moves (if you like).
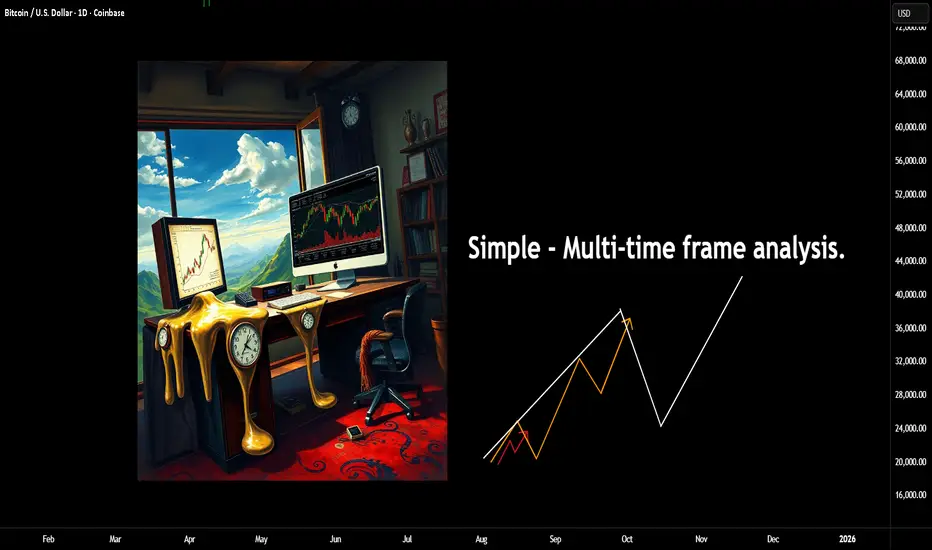
Ok, so with that being said. Let's add the second timeframe.

As you can see, the orange line represents the primary trend, whilst the internal white path now represents the secondary trend. Why this is key, is because at this stage, the larger trend also could be doing one of two things. Going UP or DOWN.
Up -
Down -
Once you understand the larger trend, the internal will work to facilitate the next leg of that higher degree. Of course, there will be reversals (but that's for another post).
Working with an uptrend for the sake of an example;

Price pushes up and then pulls back.
If we know the ranges, I have covered this in several posts recently (mechanical). We can quickly identify the higher timeframe range.
Once price breaks above this range, at some stage, you will expect to see a lower timeframe change of character, which is simply the start of a pullback on this higher timeframe. There are several ways to take advantage of this (again, another post).
But working with this example. The first move above the range happened overnight or when you were not at your desk. You now have the information to work with the next phase.

Assuming price is in a larger uptrend, you want to start to align these timeframes.

This will be the case regardless of where in the move you are.

These are only examples.
This image above shows the trigger trend in alignment with the higher timeframe. This image below shows the opposite.

Of course, there is more risk involved here as the bigger trend is going the other way, but as long as you acknowledge that, then opportunities will present themselves in both directions.
Here's a few examples on where or how to use this.

The second option is using the higher (secondary) not the trigger, but exactly the same concept.

Finally, the third option is using all three of the timeframes.
Firstly, you know the larger move is up. The second has started to align. Finally, the trigger trend (the minor) has it's change of character and you expect now the move to continue to the upside.

This gives a higher risk-to-reward ratio and often it's a higher probability in terms of the outcome. For the simple reason, the two higher timeframes now agree.
Some of the other posts connected to this one.


Anyways!
Take it easy.
Disclaimer
This idea does not constitute as financial advice. It is for educational purposes only, our principal trader has over 25 years' experience in stocks, ETF's, and Forex. Hence each trade setup might have different hold times, entry or exit conditions, and will vary from the post/idea shared here. You can use the information from this post to make your own trading plan for the instrument discussed. Trading carries a risk; a high percentage of retail traders lose money. Please keep this in mind when entering any trade. Stay safe.
As I have mentioned in a lot of my posts, all of this comes back to Dow theory; you don't need to make life hard on yourself. instead, simplify your approach and align a small number of timeframes and you will be surprised at the results.
Let me give you an example;
In this image above, you can see a clear push-up and a high, then a pullback.
Why not use this high? It had a clear change of character to the downside.
Well, the answer is - you would view these as separate timeframes. Although they are viewed on the exact same timeframe as my image. One you could call a primary trend and one a secondary.
For a bit more depth, see this post.
If you are already familiar with the idea, then the next thing you want to understand. What phase is the primary trend in?
This becomes important as you drill down to the entry timeframes, as what you are trying to do is to understand a general bias. Once you grasp this, you can even trade the counter-trend moves (if you like).
Ok, so with that being said. Let's add the second timeframe.
As you can see, the orange line represents the primary trend, whilst the internal white path now represents the secondary trend. Why this is key, is because at this stage, the larger trend also could be doing one of two things. Going UP or DOWN.
Up -
Down -
Once you understand the larger trend, the internal will work to facilitate the next leg of that higher degree. Of course, there will be reversals (but that's for another post).
Working with an uptrend for the sake of an example;
Price pushes up and then pulls back.
If we know the ranges, I have covered this in several posts recently (mechanical). We can quickly identify the higher timeframe range.
Once price breaks above this range, at some stage, you will expect to see a lower timeframe change of character, which is simply the start of a pullback on this higher timeframe. There are several ways to take advantage of this (again, another post).
But working with this example. The first move above the range happened overnight or when you were not at your desk. You now have the information to work with the next phase.
Assuming price is in a larger uptrend, you want to start to align these timeframes.
This will be the case regardless of where in the move you are.
These are only examples.
This image above shows the trigger trend in alignment with the higher timeframe. This image below shows the opposite.
Of course, there is more risk involved here as the bigger trend is going the other way, but as long as you acknowledge that, then opportunities will present themselves in both directions.
Here's a few examples on where or how to use this.
The second option is using the higher (secondary) not the trigger, but exactly the same concept.
Finally, the third option is using all three of the timeframes.
Firstly, you know the larger move is up. The second has started to align. Finally, the trigger trend (the minor) has it's change of character and you expect now the move to continue to the upside.
This gives a higher risk-to-reward ratio and often it's a higher probability in terms of the outcome. For the simple reason, the two higher timeframes now agree.
Some of the other posts connected to this one.
Anyways!
Take it easy.
Disclaimer
This idea does not constitute as financial advice. It is for educational purposes only, our principal trader has over 25 years' experience in stocks, ETF's, and Forex. Hence each trade setup might have different hold times, entry or exit conditions, and will vary from the post/idea shared here. You can use the information from this post to make your own trading plan for the instrument discussed. Trading carries a risk; a high percentage of retail traders lose money. Please keep this in mind when entering any trade. Stay safe.
Discord Server for education and advanced techniques: discord.gg/5t3w47raHe
Masterclass Webinar: mayfairtradingevents.com
Prop firm partners (FTMO)
shorturl.at/hBEQ4
Masterclass Webinar: mayfairtradingevents.com
Prop firm partners (FTMO)
shorturl.at/hBEQ4
Publicaciones relacionadas
Exención de responsabilidad
The information and publications are not meant to be, and do not constitute, financial, investment, trading, or other types of advice or recommendations supplied or endorsed by TradingView. Read more in the Terms of Use.