BTC Weekly Analysis
Disclaimer:
The information provided in this chart is for educational and informational purposes only and should not be considered as investment advice. Trading and investing involve substantial risk and are not suitable for every investor. You should carefully consider your financial situation and consult with a financial advisor before making any investment decisions. The creator of this chart does not guarantee any specific outcome or profit and is not responsible for any losses incurred as a result of using this information. Past performance is not indicative of future results. Use this information at your own risk. This chart has been created for my own improvement in Trading and Investment Analysis. Please do your own analysis before any investments.
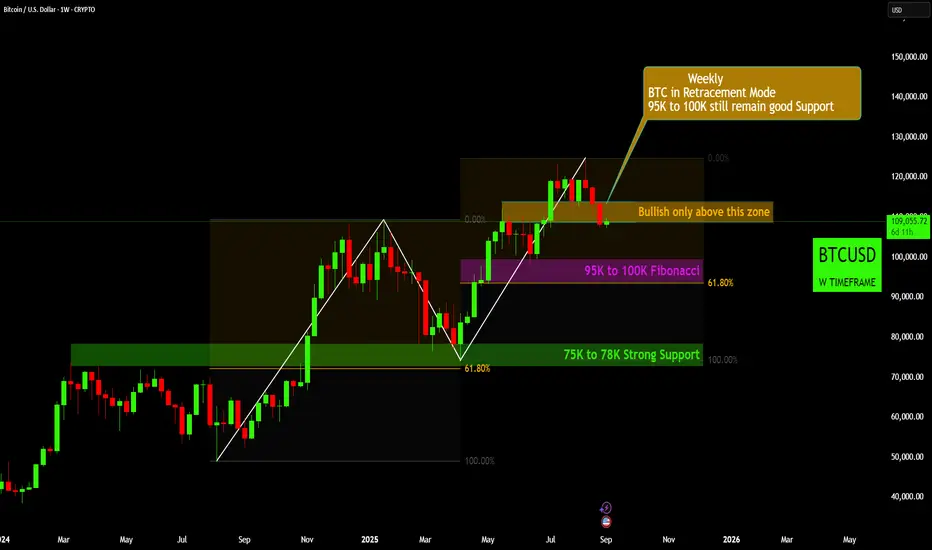
- Current State: Bitcoin (BTC) is currently in a "Weekly Retracement Mode”, but generally within a larger uptrend.
- Bullish Confirmation: For us to confirm a strong upward move, BTC needs to convincingly break and hold above the highlighted zone near 114K.
- Primary Support: Our first major support level to watch is the $95,000 to $100,000 range. This Fibonacci level is expected to act as good support if the price continues to dip.
- Stronger Support: If the 95K−95K−100K level doesn't hold, there's a very strong support zone lower down, specifically between $75,000 and $78,000, which should provide a significant bounce point.
Disclaimer:
The information provided in this chart is for educational and informational purposes only and should not be considered as investment advice. Trading and investing involve substantial risk and are not suitable for every investor. You should carefully consider your financial situation and consult with a financial advisor before making any investment decisions. The creator of this chart does not guarantee any specific outcome or profit and is not responsible for any losses incurred as a result of using this information. Past performance is not indicative of future results. Use this information at your own risk. This chart has been created for my own improvement in Trading and Investment Analysis. Please do your own analysis before any investments.
Exención de responsabilidad
La información y las publicaciones que ofrecemos, no implican ni constituyen un asesoramiento financiero, ni de inversión, trading o cualquier otro tipo de consejo o recomendación emitida o respaldada por TradingView. Puede obtener información adicional en las Condiciones de uso.