Price is moving. But not every move is an opportunity.
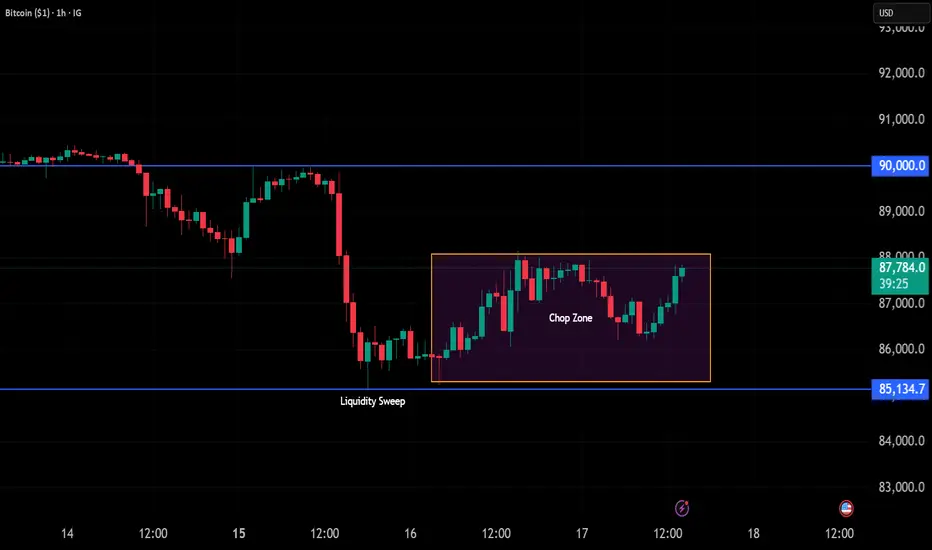
This 1H Bitcoin chart is a textbook example of why traders get chopped up — even when structure and levels look "clear."
━━━━━━━━━━━━━━━━━━━━━━━━━━━━━━━━━━━━━━━━━━━━━━━━━━━━
WHAT THIS CHART SHOWS
━━━━━━━━━━━━━━━━━━━━━━━━━━━━━━━━━━━━━━━━━━━━━━━━━━━━
Look at the price action from Dec 14–18:
- Dec 14–15: Sideways grind near 90K resistance
- Dec 15: Sharp drop from 90K → 85K (liquidity sweep)
- Dec 16–18: Price trapped in the Chop Zone (85K–88K)
Every push fades. Every breakout attempt stalls. Classic ranging behavior.
━━━━━━━━━━━━━━━━━━━━━━━━━━━━━━━━━━━━━━━━━━━━━━━━━━━━
HOW TO SPOT A RANGE
━━━━━━━━━━━━━━━━━━━━━━━━━━━━━━━━━━━━━━━━━━━━━━━━━━━━
Ask yourself:
1. Is price making higher highs AND higher lows? → If NO, likely ranging
2. Do breakouts hold? → If they fade quickly, it's a range
3. Is volatility expanding or contracting? → Contracting = range
4. Are there multiple failed attempts at the same level? → Range behavior
On this chart: ❌ No trend structure ❌ Breakouts fade ❌ Volatility flat
Verdict: RANGE — not a trending environment.
━━━━━━━━━━━━━━━━━━━━━━━━━━━━━━━━━━━━━━━━━━━━━━━━━━━━
WHY THIS MATTERS
━━━━━━━━━━━━━━━━━━━━━━━━━━━━━━━━━━━━━━━━━━━━━━━━━━━━
In ranging conditions:
- Breakouts are more likely to fail
- Continuations lack momentum
- Liquidity sweeps dominate
- Mean-reversion > trend-following
The problem isn't your entry. It's the regime mismatch.
━━━━━━━━━━━━━━━━━━━━━━━━━━━━━━━━━━━━━━━━━━━━━━━━━━━━
WHAT TO DO IN THIS ENVIRONMENT
━━━━━━━━━━━━━━━━━━━━━━━━━━━━━━━━━━━━━━━━━━━━━━━━━━━━
✓ Reduce position size
✓ Reduce trade frequency
✓ Avoid chasing breakouts
✓ Expect rotation, not extension
✓ Wait for regime shift before trending plays
Waiting is a valid trading decision.
━━━━━━━━━━━━━━━━━━━━━━━━━━━━━━━━━━━━━━━━━━━━━━━━━━━━
KEY TAKEAWAY
━━━━━━━━━━━━━━━━━━━━━━━━━━━━━━━━━━━━━━━━━━━━━━━━━━━━
Most losses happen when traders force trend logic into a market that isn't trending.
Context first. Execution second.
━━━━━━━━━━━━━━━━━━━━━━━━━━━━━━━━━━━━━━━━━━━━━━━━━━━━
This is NOT a trade call. This is NOT a buy/sell signal.
This is an educational breakdown of market behavior.
Interakktive — Next-Generation Trading Intelligence
Precision Structure • Institutional Logic • Zero Noise
Precision Structure • Institutional Logic • Zero Noise
Exención de responsabilidad
La información y las publicaciones no constituyen, ni deben considerarse como asesoramiento o recomendaciones financieras, de inversión, de trading o de otro tipo proporcionadas o respaldadas por TradingView. Más información en Condiciones de uso.