🔎 Market Structure Analysis
4H Chart (Swing Bias)
Price has been respecting the rising channel since early September.
A clean Break of Structure (BOS) is visible around 54,600, confirming higher-highs formation.
Price is currently consolidating just under the resistance zone 54,800–55,000 (OB + supply zone).
EMA (54,470) is acting as dynamic support, keeping the bullish structure intact.
Major demand zone rests at 54,000–54,200, aligning with channel midline support.
✅ Bias: Bullish-to-Neutral, but supply overhead at 54,800–55,000 could act as a short-term ceiling.
1H Chart (Intraday Bias)
A series of BOS events confirming short-term bullish momentum.
Price tested supply near 54,800, rejected, and is now hovering around 54,600–54,650.
OB + FVG zones present at 54,250–54,400 — a likely liquidity grab area if market retraces.
Upside liquidity resting above 55,000.
✅ Bias: Cautiously bullish as long as 54,250 holds.
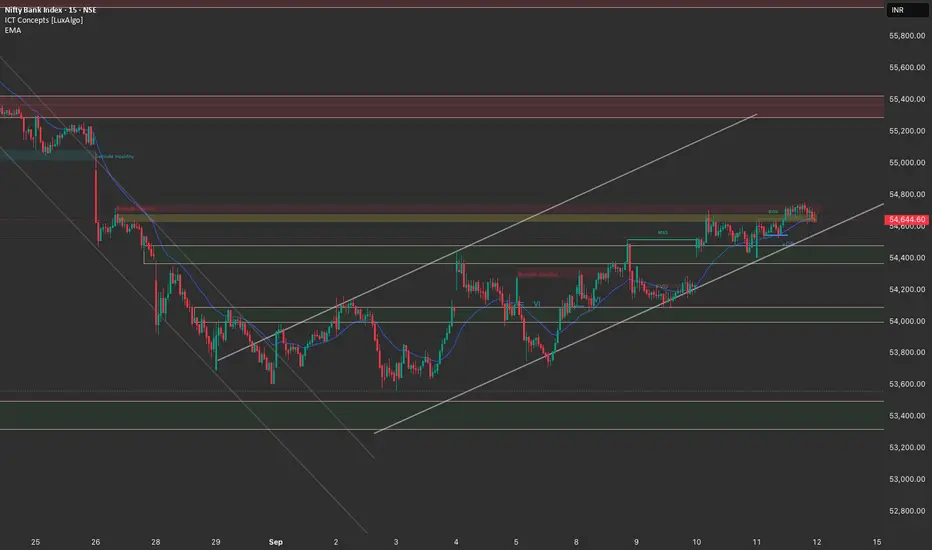
15M Chart (Execution Zone)
Price is consolidating inside 54,600–54,700 range after rejecting 54,800 zone.
Liquidity pools marked below 54,400 and above 54,800 — both sides vulnerable for sweep before clear direction.
If liquidity below 54,400 is taken, expect a bullish reaction.
If upside liquidity above 54,800 is swept, rejection from supply can trigger a sell-off.
✅ Bias: Liquidity-driven moves — careful entry required.
📌 Trade Plan for 12th Sept
Long Setup (With Trend)
Entry Zone: 54,250–54,400 (OB + FVG demand).
Target 1: 54,750
Target 2: 55,000 (liquidity sweep zone)
SL: Below 54,100
⚠️ Entry valid only if price holds demand and shows bullish rejection wick / engulfing candle on 15M.
Short Setup (Countertrend at Supply)
Entry Zone: 54,800–55,000 (supply zone + liquidity pool).
Target 1: 54,500
Target 2: 54,200
SL: Above 55,150
⚠️ Look for rejection patterns like bearish engulfing / long upper wick at supply.
Key Notes
Structure still favors bullish continuation, but supply zones are very close.
Avoid chasing — best trades are from 54,250–54,400 demand zone OR 54,800–55,000 supply zone.
Intraday volatility likely to sweep both sides before clear trend emerges.
4H Chart (Swing Bias)
Price has been respecting the rising channel since early September.
A clean Break of Structure (BOS) is visible around 54,600, confirming higher-highs formation.
Price is currently consolidating just under the resistance zone 54,800–55,000 (OB + supply zone).
EMA (54,470) is acting as dynamic support, keeping the bullish structure intact.
Major demand zone rests at 54,000–54,200, aligning with channel midline support.
✅ Bias: Bullish-to-Neutral, but supply overhead at 54,800–55,000 could act as a short-term ceiling.
1H Chart (Intraday Bias)
A series of BOS events confirming short-term bullish momentum.
Price tested supply near 54,800, rejected, and is now hovering around 54,600–54,650.
OB + FVG zones present at 54,250–54,400 — a likely liquidity grab area if market retraces.
Upside liquidity resting above 55,000.
✅ Bias: Cautiously bullish as long as 54,250 holds.
15M Chart (Execution Zone)
Price is consolidating inside 54,600–54,700 range after rejecting 54,800 zone.
Liquidity pools marked below 54,400 and above 54,800 — both sides vulnerable for sweep before clear direction.
If liquidity below 54,400 is taken, expect a bullish reaction.
If upside liquidity above 54,800 is swept, rejection from supply can trigger a sell-off.
✅ Bias: Liquidity-driven moves — careful entry required.
📌 Trade Plan for 12th Sept
Long Setup (With Trend)
Entry Zone: 54,250–54,400 (OB + FVG demand).
Target 1: 54,750
Target 2: 55,000 (liquidity sweep zone)
SL: Below 54,100
⚠️ Entry valid only if price holds demand and shows bullish rejection wick / engulfing candle on 15M.
Short Setup (Countertrend at Supply)
Entry Zone: 54,800–55,000 (supply zone + liquidity pool).
Target 1: 54,500
Target 2: 54,200
SL: Above 55,150
⚠️ Look for rejection patterns like bearish engulfing / long upper wick at supply.
Key Notes
Structure still favors bullish continuation, but supply zones are very close.
Avoid chasing — best trades are from 54,250–54,400 demand zone OR 54,800–55,000 supply zone.
Intraday volatility likely to sweep both sides before clear trend emerges.
Exención de responsabilidad
La información y las publicaciones no constituyen, ni deben considerarse como asesoramiento o recomendaciones financieras, de inversión, de trading o de otro tipo proporcionadas o respaldadas por TradingView. Más información en Condiciones de uso.
Exención de responsabilidad
La información y las publicaciones no constituyen, ni deben considerarse como asesoramiento o recomendaciones financieras, de inversión, de trading o de otro tipo proporcionadas o respaldadas por TradingView. Más información en Condiciones de uso.