📊 Bank Nifty Index – Bearish Trade Setup with TTFI Trading System & AGIESX Risk Management Tool 📉
🔹 Index: Nifty Bank (Bank Nifty)
🔹 Timeframe: 15-Minute Chart
🔹 Chart Type: Candlestick
🔹 Trading System Used: TTFI Trading System
🔹 Risk Management Tool: AGIESX
🔍 Trade Breakdown:
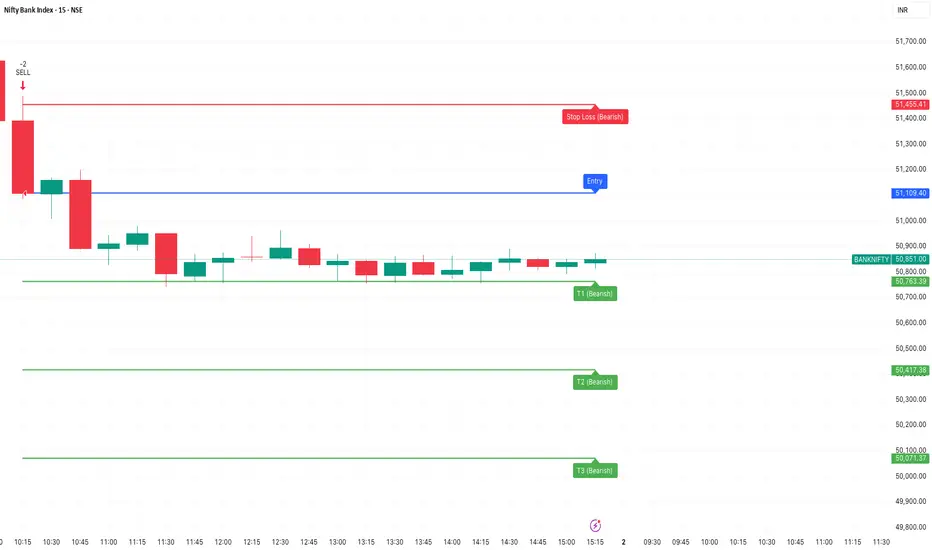
This chart represents a Bearish Trade Setup identified using the TTFI Trading System, combined with AGIESX Risk Management Tool to optimize trade execution and mitigate risks.
📌 Entry Point:
A SELL signal was triggered near 51,109.40, confirming a bearish momentum.
The signal was generated after a sharp initial drop, indicating strong selling pressure.
📌 Stop Loss (SL):
Placed at 51,455.41 (marked in red).
This SL ensures a controlled loss if the market moves against the trade.
📌 Target Levels (T1, T2, T3):
T1 (50,763.39) – First profit-taking zone, where traders may secure partial gains.
T2 (50,417.38) – A deeper support level where extended profits can be booked.
T3 (50,071.37) – Ultimate bearish target, indicating a significant downside move.
AGIESX Risk Management Tool Implementation:
✅ Strategic Stop-Loss Placement: Avoids unnecessary whipsaws while controlling downside risks.
✅ Risk-Reward Ratio Optimization: Ensures favorable risk-to-reward trade execution.
✅ Tiered Take-Profit Levels: Allows for dynamic exit planning, securing profits at different points.
💡 Key Observations:
✔ Bearish Momentum Identified Early – The initial large red candles signal strong downside pressure.
✔ Sideways Consolidation Post-Sell-Off – The market moves in a tight range, preparing for a possible breakdown.
✔ Profit-Target Alignment with Support Zones – Each TP level aligns with significant price areas, ensuring logical exits.
📉 Conclusion:
This was a well-planned short trade, combining the TTFI System's precision signals with AGIESX's structured risk management, maximizing efficiency and minimizing potential losses.
🚀 Want to execute high-probability trades with expert risk management? Stay ahead with us!
🔹 Index: Nifty Bank (Bank Nifty)
🔹 Timeframe: 15-Minute Chart
🔹 Chart Type: Candlestick
🔹 Trading System Used: TTFI Trading System
🔹 Risk Management Tool: AGIESX
🔍 Trade Breakdown:
This chart represents a Bearish Trade Setup identified using the TTFI Trading System, combined with AGIESX Risk Management Tool to optimize trade execution and mitigate risks.
📌 Entry Point:
A SELL signal was triggered near 51,109.40, confirming a bearish momentum.
The signal was generated after a sharp initial drop, indicating strong selling pressure.
📌 Stop Loss (SL):
Placed at 51,455.41 (marked in red).
This SL ensures a controlled loss if the market moves against the trade.
📌 Target Levels (T1, T2, T3):
T1 (50,763.39) – First profit-taking zone, where traders may secure partial gains.
T2 (50,417.38) – A deeper support level where extended profits can be booked.
T3 (50,071.37) – Ultimate bearish target, indicating a significant downside move.
AGIESX Risk Management Tool Implementation:
✅ Strategic Stop-Loss Placement: Avoids unnecessary whipsaws while controlling downside risks.
✅ Risk-Reward Ratio Optimization: Ensures favorable risk-to-reward trade execution.
✅ Tiered Take-Profit Levels: Allows for dynamic exit planning, securing profits at different points.
💡 Key Observations:
✔ Bearish Momentum Identified Early – The initial large red candles signal strong downside pressure.
✔ Sideways Consolidation Post-Sell-Off – The market moves in a tight range, preparing for a possible breakdown.
✔ Profit-Target Alignment with Support Zones – Each TP level aligns with significant price areas, ensuring logical exits.
📉 Conclusion:
This was a well-planned short trade, combining the TTFI System's precision signals with AGIESX's structured risk management, maximizing efficiency and minimizing potential losses.
🚀 Want to execute high-probability trades with expert risk management? Stay ahead with us!
Exención de responsabilidad
La información y las publicaciones que ofrecemos, no implican ni constituyen un asesoramiento financiero, ni de inversión, trading o cualquier otro tipo de consejo o recomendación emitida o respaldada por TradingView. Puede obtener información adicional en las Condiciones de uso.