The market's performance on Friday, September 26, the Bank Nifty has experienced a decisive breakdown, accelerating its corrective move and closing near a crucial support zone. The market is now in a strong bearish trend on all lower timeframes.
Detailed Market Structure Breakdown
4-Hour Chart (Macro Trend)
Structure: The Bank Nifty has confirmed a deep corrective phase. The price has broken below multiple intermediate supports and the crucial 54,750 level. It is now testing the major demand zone around 54,250 - 54,400. This area represents a major support level from the base of the rally that began in early September.
Key Levels:
Major Supply (Resistance): 54,750 - 54,850. This area, which was a strong support, is now the immediate and most critical resistance.
Major Demand (Support): 54,250 - 54,400. This is the key "line in the sand." A sustained break below 54,250 would signal a deeper correction toward the next macro support at 53,500 - 53,750.
Outlook: The short-term macro bias is bearish. The market is sitting on a major support level, and its ability to hold this level on Monday will determine the near-term direction.
1-Hour Chart (Intermediate View)
Structure: The 1H chart is strongly bearish, trading in a well-defined descending channel and consistently making lower lows and lower highs. The price closed right near the channel support and the major horizontal demand zone.
Key Levels:
Immediate Resistance: The upper trendline of the descending channel, currently near 54,750.
Immediate Support: 54,250. This is the level that bulls must defend at the open.
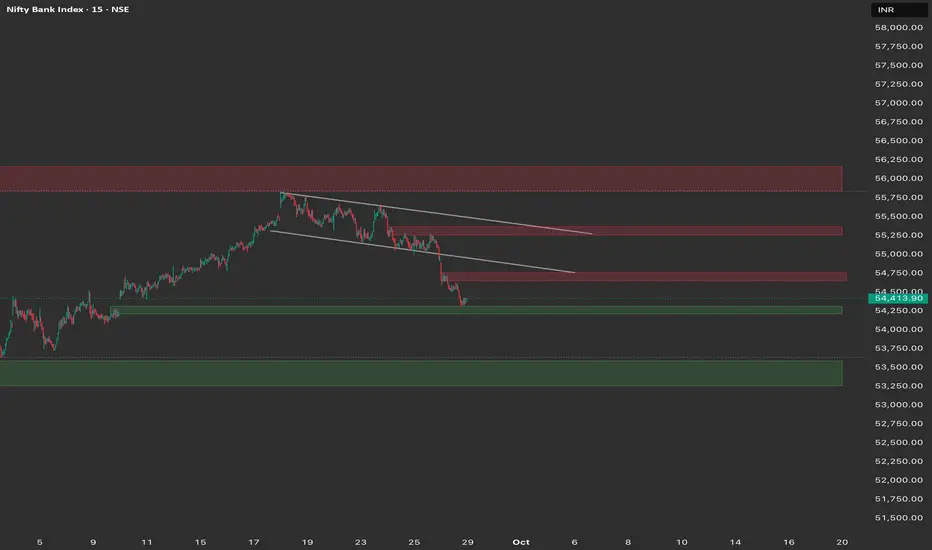
15-Minute Chart (Intraday View)
Structure: The 15M chart confirms the steep bearish momentum. The index is trading at the bottom of its current descending channel. The close right on the 54,300 level suggests a potential for a short-term bounce or a breakdown.
Key Levels:
Intraday Supply: 54,750. This is the immediate resistance, aligning with the upper channel line.
Intraday Demand: 54,250. The crucial level to watch for Monday.
Outlook: The primary strategy is to sell into any rise or on a breakdown, as the overall trend is down.
Trade Plan (Monday, 29th September)
Market Outlook: The Bank Nifty is bearish, but located at a major, high-confluence support zone. The strategy is centered on whether 54,250 holds.
Bearish Scenario (Primary Plan)
Justification: The breakdown below the macro support at 54,250 would confirm the continuation of the strong bearish trend toward the next accumulation zone.
Entry: Short entry on a decisive break and 15-minute candle close below 54,250.
Stop Loss (SL): Place a stop loss above 54,450 (above the immediate swing high).
Targets:
T1: 54,000 (Psychological level).
T2: 53,500 - 53,750 (Major 4H demand zone).
Bullish Scenario (Counter-Trend/Reversal Plan)
Justification: This is a high-risk, counter-trend plan. It relies on the strong demand zone at 54,250 holding firm.
Trigger: A reversal from the 54,250 - 54,400 zone (e.g., a hammer or bullish engulfing candle) or a sustained move and close above 54,850.
Entry: Long entry on a confirmed bounce from 54,250 - 54,400 with a bullish pattern, or on a break above 54,850.
Stop Loss (SL): Below 54,150 (for a bounce trade) or 54,650 (for a breakout trade).
Targets:
T1: 55,000 (Psychological resistance).
T2: 55,250 (Upper end of the descending channel).
Key Levels for Observation:
Immediate Decision Point: The 54,250 - 54,500 zone.
Bearish Confirmation: A break and sustained move below 54,250.
Bullish Confirmation: A recapture of the 54,850 level.
Line in the Sand: 54,250. The overall bullish trend is in serious jeopardy below this level.
Detailed Market Structure Breakdown
4-Hour Chart (Macro Trend)
Structure: The Bank Nifty has confirmed a deep corrective phase. The price has broken below multiple intermediate supports and the crucial 54,750 level. It is now testing the major demand zone around 54,250 - 54,400. This area represents a major support level from the base of the rally that began in early September.
Key Levels:
Major Supply (Resistance): 54,750 - 54,850. This area, which was a strong support, is now the immediate and most critical resistance.
Major Demand (Support): 54,250 - 54,400. This is the key "line in the sand." A sustained break below 54,250 would signal a deeper correction toward the next macro support at 53,500 - 53,750.
Outlook: The short-term macro bias is bearish. The market is sitting on a major support level, and its ability to hold this level on Monday will determine the near-term direction.
1-Hour Chart (Intermediate View)
Structure: The 1H chart is strongly bearish, trading in a well-defined descending channel and consistently making lower lows and lower highs. The price closed right near the channel support and the major horizontal demand zone.
Key Levels:
Immediate Resistance: The upper trendline of the descending channel, currently near 54,750.
Immediate Support: 54,250. This is the level that bulls must defend at the open.
15-Minute Chart (Intraday View)
Structure: The 15M chart confirms the steep bearish momentum. The index is trading at the bottom of its current descending channel. The close right on the 54,300 level suggests a potential for a short-term bounce or a breakdown.
Key Levels:
Intraday Supply: 54,750. This is the immediate resistance, aligning with the upper channel line.
Intraday Demand: 54,250. The crucial level to watch for Monday.
Outlook: The primary strategy is to sell into any rise or on a breakdown, as the overall trend is down.
Trade Plan (Monday, 29th September)
Market Outlook: The Bank Nifty is bearish, but located at a major, high-confluence support zone. The strategy is centered on whether 54,250 holds.
Bearish Scenario (Primary Plan)
Justification: The breakdown below the macro support at 54,250 would confirm the continuation of the strong bearish trend toward the next accumulation zone.
Entry: Short entry on a decisive break and 15-minute candle close below 54,250.
Stop Loss (SL): Place a stop loss above 54,450 (above the immediate swing high).
Targets:
T1: 54,000 (Psychological level).
T2: 53,500 - 53,750 (Major 4H demand zone).
Bullish Scenario (Counter-Trend/Reversal Plan)
Justification: This is a high-risk, counter-trend plan. It relies on the strong demand zone at 54,250 holding firm.
Trigger: A reversal from the 54,250 - 54,400 zone (e.g., a hammer or bullish engulfing candle) or a sustained move and close above 54,850.
Entry: Long entry on a confirmed bounce from 54,250 - 54,400 with a bullish pattern, or on a break above 54,850.
Stop Loss (SL): Below 54,150 (for a bounce trade) or 54,650 (for a breakout trade).
Targets:
T1: 55,000 (Psychological resistance).
T2: 55,250 (Upper end of the descending channel).
Key Levels for Observation:
Immediate Decision Point: The 54,250 - 54,500 zone.
Bearish Confirmation: A break and sustained move below 54,250.
Bullish Confirmation: A recapture of the 54,850 level.
Line in the Sand: 54,250. The overall bullish trend is in serious jeopardy below this level.
Exención de responsabilidad
La información y las publicaciones no constituyen, ni deben considerarse como asesoramiento o recomendaciones financieras, de inversión, de trading o de otro tipo proporcionadas o respaldadas por TradingView. Más información en Condiciones de uso.
Exención de responsabilidad
La información y las publicaciones no constituyen, ni deben considerarse como asesoramiento o recomendaciones financieras, de inversión, de trading o de otro tipo proporcionadas o respaldadas por TradingView. Más información en Condiciones de uso.