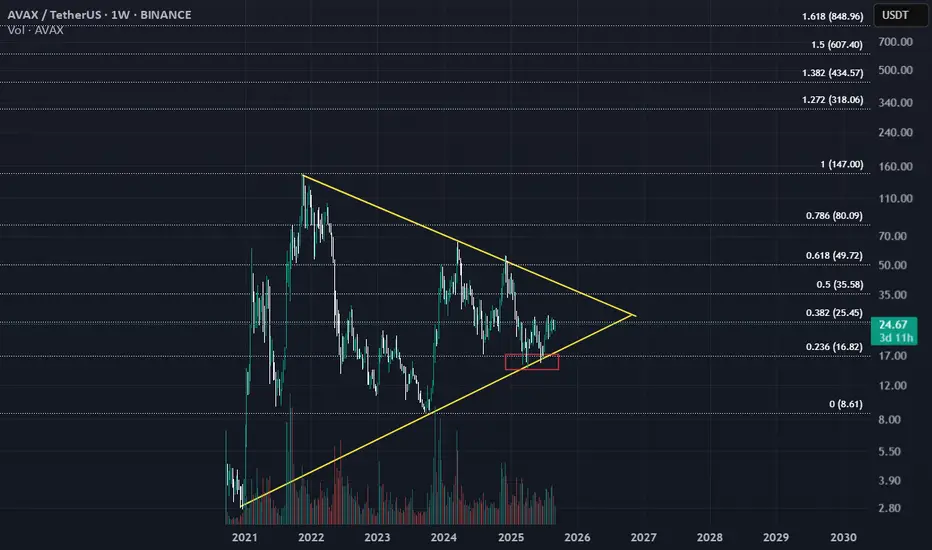
The current price of AVAX is $24.72, with a weekly high of $25.78 and a low of $22.67. The price has increased by 5.64% or $1.32 compared to the previous week's close.
The chart also displays several key technical indicators and levels:
Volume: The trading volume for the AVAX/USDT pair is shown at the bottom of the chart, with the current weekly volume at 12.03M.
Support and Resistance Levels: The chart appears to show a symmetrical triangle pattern, with the price consolidating between the support and resistance levels. The support level is around $16.82, while the resistance level is around $35.58.
Trend Lines: The chart shows along tterm triangle, indicating a potential exploding trend for the AVAX/USDT pair may be begin soon.
Note: dont forget put stop loss in each trade.
Exención de responsabilidad
The information and publications are not meant to be, and do not constitute, financial, investment, trading, or other types of advice or recommendations supplied or endorsed by TradingView. Read more in the Terms of Use.
Exención de responsabilidad
The information and publications are not meant to be, and do not constitute, financial, investment, trading, or other types of advice or recommendations supplied or endorsed by TradingView. Read more in the Terms of Use.