### 📊 **Aeroflex Industries Ltd - Technical Analysis Summary (Daily Chart)**
#### 🚀 **Breakout Overview**
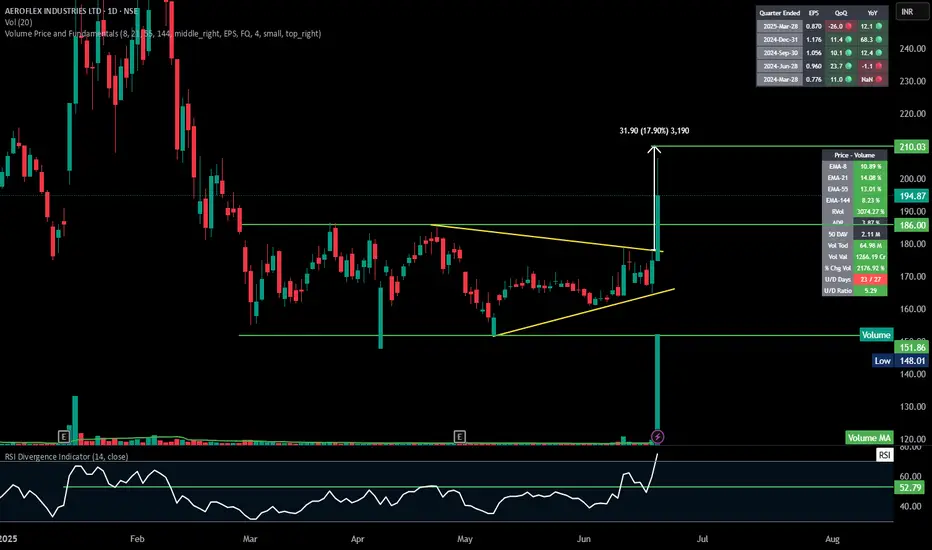
* **Pattern**: Symmetrical triangle breakout (tight range → explosive move)
* **Breakout Confirmation**: Massive bullish candle (+11.45%) with **volume spike (64.98M)** — over **1200% above average**
* **Breakout Level**: \~₹174–₹176
#### 🎯 **Target Projection**
* **Height of Triangle (Approx)**: ₹31.90
* **Target Price**: ₹176 (breakout level) + ₹31.90 ≈ **₹210**
#### 📌 **Key Price Levels**
* **Current Price**: ₹194.87
* **Immediate Resistance / Target**: ₹210
* **Support**: ₹186 (previous swing high and breakout retest level)
* **Stop Loss Zone**: Below ₹174
#### 📈 **Volume & Indicators**
* **RSI**: 74.80 — Overbought, but confirms strong momentum
* **EMA Confluence**:
* EMA-8: +10.89%
* EMA-21: +14.08%
* EMA-55: +13.01%
* EMA-144: +8.23%
* **RVol**: 3074.27% — Heavy institutional activity likely
* **U/D Ratio**: 5.29 — Strong buying dominance
#### 🧠 **Inference**
* **Strong bullish breakout** with rising volume and RSI confirmation.
* Good follow-through expected up to **₹210**.
* Watch for minor pullbacks or consolidation near ₹186 for potential entry on retest.
---
#### 🚀 **Breakout Overview**
* **Pattern**: Symmetrical triangle breakout (tight range → explosive move)
* **Breakout Confirmation**: Massive bullish candle (+11.45%) with **volume spike (64.98M)** — over **1200% above average**
* **Breakout Level**: \~₹174–₹176
#### 🎯 **Target Projection**
* **Height of Triangle (Approx)**: ₹31.90
* **Target Price**: ₹176 (breakout level) + ₹31.90 ≈ **₹210**
#### 📌 **Key Price Levels**
* **Current Price**: ₹194.87
* **Immediate Resistance / Target**: ₹210
* **Support**: ₹186 (previous swing high and breakout retest level)
* **Stop Loss Zone**: Below ₹174
#### 📈 **Volume & Indicators**
* **RSI**: 74.80 — Overbought, but confirms strong momentum
* **EMA Confluence**:
* EMA-8: +10.89%
* EMA-21: +14.08%
* EMA-55: +13.01%
* EMA-144: +8.23%
* **RVol**: 3074.27% — Heavy institutional activity likely
* **U/D Ratio**: 5.29 — Strong buying dominance
#### 🧠 **Inference**
* **Strong bullish breakout** with rising volume and RSI confirmation.
* Good follow-through expected up to **₹210**.
* Watch for minor pullbacks or consolidation near ₹186 for potential entry on retest.
---
Exención de responsabilidad
The information and publications are not meant to be, and do not constitute, financial, investment, trading, or other types of advice or recommendations supplied or endorsed by TradingView. Read more in the Terms of Use.
Exención de responsabilidad
The information and publications are not meant to be, and do not constitute, financial, investment, trading, or other types of advice or recommendations supplied or endorsed by TradingView. Read more in the Terms of Use.