Please see AAPL chart posted before this one from few days ago*
Still holding small long position. Things I'm watching to adjust / add to my position:
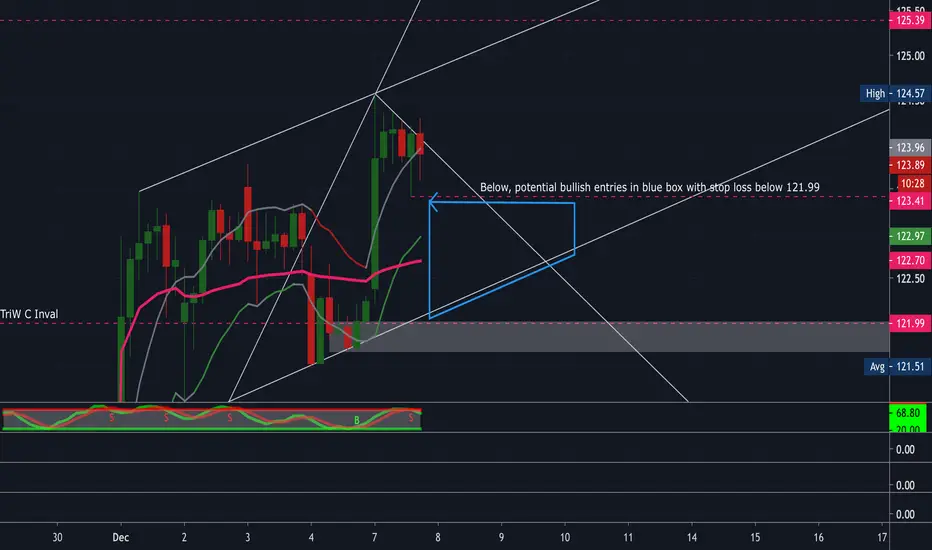
1. Risky: potential small short scalp trade (I entered buy Jan 15 120 put / sold 117.50 put) for cost of $84; stop loss if break high of day of $124.57)
2. Price is consolidating just below the high of 124.57; if goes below $123.41, will watch to see if potential opportunity to add to bullish longs (and exit of small scalp trade above if able to generate a few bucks profit)
3. If below $122, will watch for support line in white to hold. My key low to invalidate adding to any more bullish longs is if price goes below $121.99.
This is just a small, maybe one or two day hold trade regarding my scalp.
Again, this is just a potential smaller time frame chart to watch. If, going off previous apple chart post, price stays above the TriW C wave of $121.99, I will lean bullish still and look to add another small bullish long if I can get in below $123.41, watching for break above $125 to maintain my longs.
Still holding small long position. Things I'm watching to adjust / add to my position:
1. Risky: potential small short scalp trade (I entered buy Jan 15 120 put / sold 117.50 put) for cost of $84; stop loss if break high of day of $124.57)
2. Price is consolidating just below the high of 124.57; if goes below $123.41, will watch to see if potential opportunity to add to bullish longs (and exit of small scalp trade above if able to generate a few bucks profit)
3. If below $122, will watch for support line in white to hold. My key low to invalidate adding to any more bullish longs is if price goes below $121.99.
This is just a small, maybe one or two day hold trade regarding my scalp.
Again, this is just a potential smaller time frame chart to watch. If, going off previous apple chart post, price stays above the TriW C wave of $121.99, I will lean bullish still and look to add another small bullish long if I can get in below $123.41, watching for break above $125 to maintain my longs.
Exención de responsabilidad
La información y las publicaciones que ofrecemos, no implican ni constituyen un asesoramiento financiero, ni de inversión, trading o cualquier otro tipo de consejo o recomendación emitida o respaldada por TradingView. Puede obtener información adicional en las Condiciones de uso.