Buy JNJ (Johnson and Johnson)Compra NYSE:JNJ Precio: $147.11
TP: $157.95
TP2: $160.44
SL: $143.50
Fundamentos y observaciones:
-P/E 14.39x(Max 20.08x; Media 16.38x; Sector 20.68x)👍.
-Buena recompra de acciones constante; Reducción de -7.10% YOY✅.
-Valor intrínseco $161.82; Peor $128.72; Mejor $233.22👍.
-Poco margen de maniobra a corto plazo, mayor margen en largo plazo👍.
-ROIC 21.30%👍.
-Pertenece a 29 ETF´s👍.
-M. Bruto 69.39%; M. Operativo 26.40%; M. Neto 16.74%✅.
-Ingreso trimestral 2014: 37.61B; EPS 2014: 1.66.
Ultimo trimestre 2024: 22.5B ; EPS 2024: 2.42 👍👎.
16/12/24
Ideas de trading de JNJ

Johnson & Johson: un clásico de la bolsaJohnson & Johnson seguramente ya está en muchas carteras, sobre todo las más largoplacistas y especialmente para quien le guste el dividendo, si no voy mal lleva 54 años seguidos incrementando el importe a pagar.
A mí personalmente no me gusta el dividendo en una cartera normal: pagas impuestos aunque reinviertas y descapitalizas, y si quieres recomprar has pagado impuestos y pagas comisiones. Diferente en un fondo, SICAV o plan de pensiones ya que se ahorran la parte fiscal y las comisiones de recompra quedan muy diluidas.
Esta acotación sirve para explicar que no es por el dividendo, pero sí que hay ratios más que interesantes como las expectativas de bajadas de PER, de 21,2x para este año al 15,6x para 2026; al incremento esperado de rentabilidad (no solo de ingresos), a la generación de caja...
Desde luego, las caídas de las últimas semanas lo ha vuelto a situar en un escenario atractivo, de hecho el consenso de analistas marcan casi un 20% de revalorización.
Tampoco hay que volverse loco con este dato, pero es verdad que, al contrario que otras empresas, el valor objetivo es muy estable y lo que se está moviendo más es la cotización (en otros casos, el objetivo sigue al precio, más que al revés).
Precisamente este movimiento de precios ha dado una señal también técnica:
Desde principios de 2021 se está moviento en un lateral muy amplio que coincide con el movimiento entre máximos históricos y el 31,8% de retroceso de la subida post COVID.
Además en este caso lo ha hecho apoyándose en una directriz muy bonita iniciada en 2016, y con un estocástico (tanto en diario como semanal) atractivo, sin llegar a ser un punto fundamental.
Otro aspecto a tener en cuenta, para quien lo tenga más a corto-medio plazo es que el gráfico también permite una salida interesante: los mínimos de 2023-24 los ha hecho saliéndose un poco de ese canal, hablamos de un 5% aprox, porcentaje muy inferior a un objetivo situado en máximos históricos o cerca.
De hecho daría hasta para colocar stop por debajo del 50% de retroceso de la subida mencionada, pero bueno... eso cada uno...

#JNJ - johnson & Johnson**#JNJ - johnson & Johnson**
Se puede ver que ejecutó un HCH que lo lleva a un valor de 150 dólares desde los 168 de la cabeza.
La baja parece ser un ABC de Elliot.
La proyección de la cabeza coincide con los 1,618 de la primera extensión de Fibonacci
Luego fue al punto B del 1 de dicho Fibonacci, y luego sigue a la baja a nuevos mínimos, que por 2º proyección de Fibonacci, puede llegar a los 147 o 145 dólares, quizás menos.
Sin Embargo sigue en el canal descendiente. Hay que ver que hace con el soporte dinámico creciente amarillo.
Sumind dando venta en diario y semanal.
¿Que opinan?

Buy JNJ (Johnson & Jonhson)Compra NYSE:JNJ Precio: $150.15
TP: $162.46
TP2: $166.00
SL: $146.05
Fundamentos y observaciones:
-P/E 14.82x(Max 20.08x; Media 16.38x; Sector 20.68x)👍.
-Buena recompra de acciones constante; Reducción de -7.10% YOY✅.
-Valor intrínseco $161.82; Peor $128.72; Mejor $233.22👍.
-Poco margen de maniobra a corto plazo, mayor margen en largo plazo👍.
-ROIC 21.30%👍.
-Pertenece a 29 ETF´s👍.
-M. Bruto 69.39%; M. Operativo 26.40%; M. Neto 16.74%✅.
-Ingreso trimestral 2014: 37.61B; EPS 2014: 1.66.
Ultimo trimestre 2024: 22.5B ; EPS 2024: 2.42 👍👎.
09/12/24

$JNJ - BAJISTA - CANAL A LA BAJA - TRADE YA INICIADOHola trades, es muy dificil publicar todos mis trades y todo lo que veo en el día. No encuentro un medio social para ser más rápido en la publicación de ideas.
En esta ocasión me encuentro haciendo un short de NYSE:JNJ , una victoria de Trump, podría afectar el sector Pharma, Biotech y Medial Services

JOHNSON & JOHNSON: A por nuevos máximos!!Desde el 16 de Julio 2024, el aspecto técnico de la compañía Johnson & Jonhson es claramente alcista. El día 4 de septiembre tocó máximos en la zona 168 e inició un pequeño retroceso. Los días 10 y 18 de septiembre volvió a intentar romper la zona de máximos, pero el precio fue rechazado, iniciando una fase de corrección que llevó el precio hasta la zona 158 ( -5.6% ), coincidiendo con el soporte dinámico más importante en la temporalidad H4.
El día 9 de Octubre el indicador IVO nos dio la primera señal alcista ( Bull ) de un posible FIN del retroceso, y como se puede observar en el gráfico, el precio empezó a subir de nuevo. La segunda señal alcista ( Bull ) nos la mostró el día que presentó resultados, que fueron mejores de lo esperado.
Por lo tanto, si a los resultados, sumamos que su aspecto técnico es claramente alcista, todo nos hace pensar que atacará nuevamente la zona de máximos en los 168 y que de superarla, iniciará un nuevo impulso alcista.
--------------------------------------
Estrategia --> Entraremos largos con los siguientes parámetros:
ENTRADA : Abriremos 2 posiciones largas en la zona actual de los 165
POSICIÓN 1 ( TP1 ): Cerramos primera posición en la zona de máximos, en los 168 ( +2% )
--> Stop Loss en los 162 ( -2% ).
POSICIÓN 2 ( TP2 ): Abrimos una posición tipo Trailing Stop.
--> Stop Loss dinámico inicial a -2% ( coincidiendo con los 162 de la posición 1 ).
--> Modificamos el Stop Loss dinámico a -1% cuando el precio alcance el TP1 ( 168 ).
-------------------------------------------
ACLARACIONES DEL SET UP
*** ¿ Cómo saber qué 2 posiciones largas abrir ? Pongamos un ejemplo : Si queremos invertir 2.000 euros en la acción, lo que hacemos es dividir entre 2 esa cantidad, y en vez de abrir 1 posición de 2.000 , abriremos 2 posiciones de 1.000 cada una.
*** ¿ Qué es Trailing Stop ? Un Trailing Stop permite que un trading siga ganando valor cuando el precio del mercado se mueve en una dirección favorable, pero cierra automáticamente el trading si el precio del mercado se mueve repentinamente en una dirección desfavorable por una distancia determinada. Esa distancia determinada es el Stop Loss dinámico.
-->Ejemplo : SI el Stop Loss dinámico está a -1% , significa que si el precio realiza una bajada de un -1% , se cerrará la posición. Si el precio sube, el Stop Loss sube también para mantener ese -1% en las subidas, por lo tanto, el riesgo es cada vez menor hasta entrar en beneficios la posición. De este modo se pueden aprovechar tendencias muy sólidas y estables en el precio, maximizando beneficios.


Jhonson & Jhonson JNJ, sorprendiendo, full bullish Una empresa que tiene un gran porcentage del mercado en el que se desempeña, creemos acaso que se viene un bombazo de Microsoft que impulse a los inversionistas a tener más confianza en la industria farmacéutica y de salud, descubrelo en el video que he hechoe specialmente analizando particularidades específicas.

Johnson & Johnson (JNJ): Se esperan más caídasEn abril, anticipamos una corrección para JNJ y, desde entonces, la acción ha caído aproximadamente un 7%, alineándose con nuestras expectativas. La tendencia actual sugiere un movimiento descendente adicional, reforzando nuestro análisis previo.
Nos estamos enfocando en la zona de soporte que va desde $134 hasta $116, con un límite inferior potencial en $109, el mínimo del Corona. La corrección en curso podría representar la finalización de la Onda (4) dentro de esta zona objetivo, alineándose con múltiples niveles.
Vamos a estar monitoreando esto en busca de señales de una reversión dentro de esta zona. Esta zona será crucial para confirmar el próximo posible movimiento alcista.

JNJ LARGOSTrade SWING largo en JNJ buscando un R:R de 3.1. Nos apoyamos en zona baja de valor VAL, buscando retomar el valor de antes y acabar en la zona alta del valor, con un TP conservador.

BUY - JNJ (Johnson & Johnson)Buy NYSE:JNJ price: $145.49
TP: $156.43
SL: $141.84
bajo lotaje - low lotage

CRUCE DE MEDIAS BAJISTAEn gráfico semanal tenemos un cruce de medias bajista.
Además, la tendencia del gráfico es bajista.
Es posible que veamos nuevos mínimos en las próximas semanas.

Posible compra en JNJTendencia bajista formada por bloques de liquidez, ahora el análisis que he hecho y teniendo en cuenta las velas alcistas formadas en esta nueva liquidez considero un cambio de tendencia con una gran proyección.

$JNJ inicia salida al alza +10% probableNYSE:JNJ parece haber terminado una sana corrección para continuar al alza dando un posible BO con rendimiento de +6% y luego +10% en un movimiento de zig-zag ABC clásico.

Posible venta en JNJ (Johnson & Johnson)Tendencia alcista que viene perdiendo fuerza, límite con bloque de liquidez, espero una reversión a niveles muy inferiores.

Proyección de Johnson & JohnsonLos futuros anticipan un comienzo de semana en negativo (-0,30%) , las acciones asiáticas corrigen las subidas iniciales de la sesión tras conocerse que los beneficios industriales desaceleraban considerablemente en China, lo que ha reducido el optimismo vivido la semana pasada, esta actualización macro sugiere nuevamente que la velocidad de recuperación de la economía china no es la deseada.
La semana va a estar marcada por los datos macroeconómicos entre los que destacan la inflación en la eurozona, los PMIs de China, EE.UU. y Europa y los datos del consumo personal en EE.UU. LA atención se centrará principalmente en la evolución de los datos macroeconómicos chinos que darán mayor claridad sobre la salud de la segunda mayor economía mundial.
La deuda a 10 años repuntaba en EE.UU. 5 pbs hasta el 4,51% , el nivel más alto de la última semana, lo que podría facilitar la fortaleza de USD como activo refugio/de cobertura . También es destacable los niveles alcanzados por el VIX, mínimos desde 2020 lo que demuestra la confianza en los mercados pero que también invita a posibles movimientos de cierta importancia si la macro o la política no va por el camino esperado. En este sentido una posible extensión de la tregua entre Israel y Hamas podría ser una buena señal para las bolsas. Por lo que respecta al crudo, corrige por cuarta sesión a la espera de las resoluciones de la próxima reunión cuyo retraso ha generado importante volatilidad en la materia prima.
Fuente: GVC Gaesco

Entrada en [LARGO] en Jonhson & Johnson 💪La acción de Johnson & Johnson de la bolsa de valores de Estados Unidos ya tiene tendencia alcista en las 3 temporalidades de medio plazo, mensual, semanal y diario. El precio está reaccionando a largo plazo desde un nivel de demanda de velas de un mes y se crean nuevos niveles de demanda a medida que el precio hace su construcción de tendencia alcista. Para que siga y respete esta tendencia debe respetar los niveles de demanda, por tanto son entradas de alta probabilidad. Largos para #JNJ.
Medio Plazo Largo desde 174.40$ en v1d

#JNJ - Johnson & Johnson#JNJ - Johnson & Johnson
¿Posibilidad de un HCH?
Creo que no, pero cuidado ⚠️

#JNJ - Johnson y Johnson#JNJ - Johnson y Johnson
Se propone que estudien este trading.
Semanalmente viene en este canal desde el 2013, hace 10 años, ¿Por que cambiar ahora? además, parece que rebotó cerca de la base del canal o SD+ en los 157.
SumInd semanal da venta, ojo con eso, y las manos grandes son vendedoras, pero están menguando.
SumInd en diario está en W&S vendidos, y las manos grandes están por empezar a comprar.
Puede fallar, observarla. El trading propuesto es tener el TSL en el SD+ y el TP sobre los 0,5 o 0,618 de Fibonacci. Puede ir a la RD- amarilla en los 175.

JNJ 📈 Vemos que actualmente se encuentra atravezando un triangulo el cual no miestra debilidad en el piso al momento. Próximo precios a superar 165, para ir a buscar el techo del triangulo.

A la espera de confirmación para una suba del 7.5%Vemos que el viernes JNJ ha llegado a $160.48 haciendo contacto con el soporte dinamico del canal ascendente que viene respetando desde fines de Marzo.
Nótese que desde el 21-agosto comenzó su swing bajista coincidentemente con grandísima cantidad de inversores chicos que fueron vendiendo posiciones (marcado abajo con óvalo rojo) haciendo bajar el precio de la acción.
En la onda ascendente previa, las manos grandes han estado comprando desde el 20-JUL hasta el 16-AGO momento donde fué perdiendo fuerza el alza.
Vemos cono se respetaron los pisos y techos dinámicos del canal, y tambien las resistencias por lo que entiendo, que en la próxima semana es esperable que luego de testear éste soporte comience una nueva etapa de alza, probablemente frenandose en la resistencia de los $164.42 (que también coincidirá con la EMA de 200) para luego toparse con la de $173.30. Sería ideal, que luego toque techo de canal aproximadamente en los $178.-
En caso de seguir tendencia bajista se frenaría el impulso en el soporte de $158.10 para lo cual pondré un stop loss en $156.87
Respaldo este pronóstico alcista con el hechi de que el RSI se encuentra en el subsuelo (aunque no muestra signos de reversión) y Koncorde en cero.
Espero una suba de 7.5% o el ideal del 11%, y una pérdida del 2.3%
Antes de entrar me quedo a esperar que por 1 o 2 jornadas testee ese piso y luego de 1 o 2 dias más comience el cambio de tendencia. Ahí entraré con posiciones.

OPORTUNIDAD DE INVERSIONEl precio de Johnson & Johnson rebota en la liena de tendencia por 3 vez al rededor de la zona pivote 175.90/174.10, el rechazo ha generado la posibilidad de un doble techo. La figura se confirmaria con cierres por debajo de 165 lo que desencadenaria una posible rotacion a la zona pivote 157.30/156.20, esto concuerda con la objetivo minimo que marcaria el doble techo.

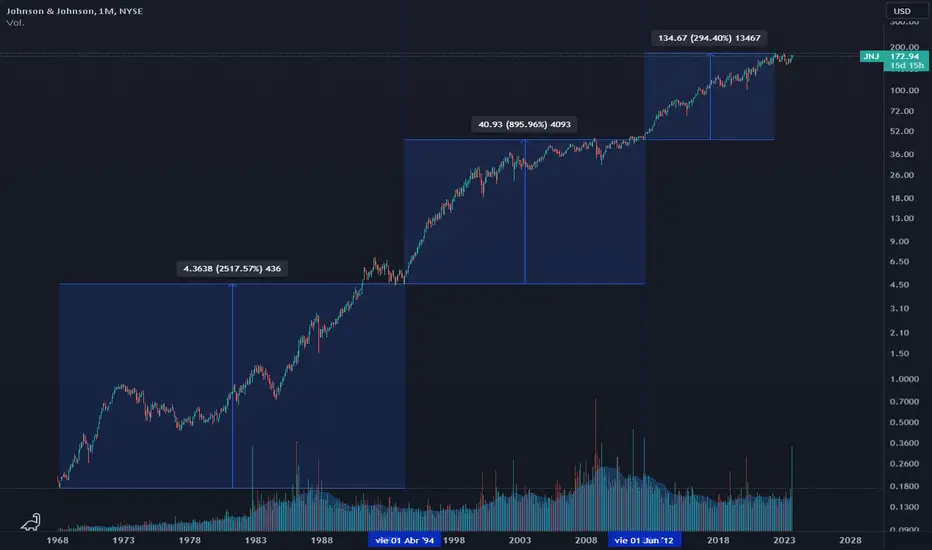
Escala lineal vs logarítmica: comparativa visual --LOGARITMICA--
Mismos acción, mismo rangos de precios en las 2 escalas:
- En la escala Lineal se aprecian claramente 3 zonas diferentes de crecimiento del precio, donde en cada una pareciera haber un aumento más acelerado del mismo. Se puede cometer el error de asociarlo a un mayor rendimiento porcentual, no obstante, lo que en realidad vemos es la variación en el valor ABSOLUTO del precio de la acción.
- En la escala logarítmica, las mismas zonas quedan visualmente representadas de una forma muy diferente, donde ahora sí se ve una correlación positiva entre la variación del precio (en su escala exponencial) y el rendimiento porcentual obtenido, es decir, la variación RELATIVA entre el precio de inicio y el precio final.
Midiendo con la regla, claramente no hay diferencia en lo obtenido en el mismo rango de velas y precios, no obstante la impresión visual rápida y sin medir puede llevarnos a un error importante en el análisis. Al comparar 2 o más rangos de precios de un mismo activo, mientras mayor sea la diferencia entre los precios de un rango y del otro mayor será la distorsión en el gráfico; en tal caso, lo mejor siempre es observar y comparar en ambas escalas...y medir por supuesto.