Mapas macro en TradingView: explore, compare, siga
Comprender las tendencias globales y el estado actual del mercado es la base del análisis financiero. Independientemente del activo con el que opere, conocer los indicadores económicos clave puede ayudarle a mejorar su estrategia de trading. Con nuestros mapas macroeconómicos, podrá identificar las tendencias globales para navegar de forma más eficaz por el complejo y cambiante panorama financiero.
CONTENIDO:
- ¿Qué son los mapas macroeconómicos?
- ¿Cómo acceder a los mapas macroeconómicos?
- ¿Cómo utilizar los mapas macroeconómicos?
¿Qué son los mapas macroeconómicos?
Los mapas macroeconómicos visualizan los indicadores económicos globales mediante un código de colores que asigna a cada país del mapa mundial en función de su rendimiento económico. Puede comparar economías utilizando diversos indicadores, como el PIB, las estadísticas laborales, los niveles de precios y muchos más.
Además, puede ajustarlos para mostrar datos de un periodo de tiempo específico con una precisión de hasta un mes, lo que le permite realizar análisis históricos detallados e identificar tendencias.
¿Cómo acceder a los mapas macro?
Para comenzar su análisis financiero, haga clic en el botón «Productos» de la barra de herramientas derecha y seleccione «Mapas macro».
Estos aparecerán en una ventana lateral deslizante desde cualquier página de TradingView. Si utiliza Supercharts, considere dividir la pantalla para ver simultáneamente el activo y comprender los factores subyacentes que impulsan su movimiento.
¿Cómo utilizar los mapas macroeconómicos?
Esta herramienta es muy fácil de usar. Los datos completos que muestra pueden servirle de base para sus próximas decisiones de inversión. Esto se debe a que las condiciones económicas generales afectan a las economías individuales, y ninguna de ellas existe de forma aislada: comprender estas interconexiones es clave para operar con éxito.
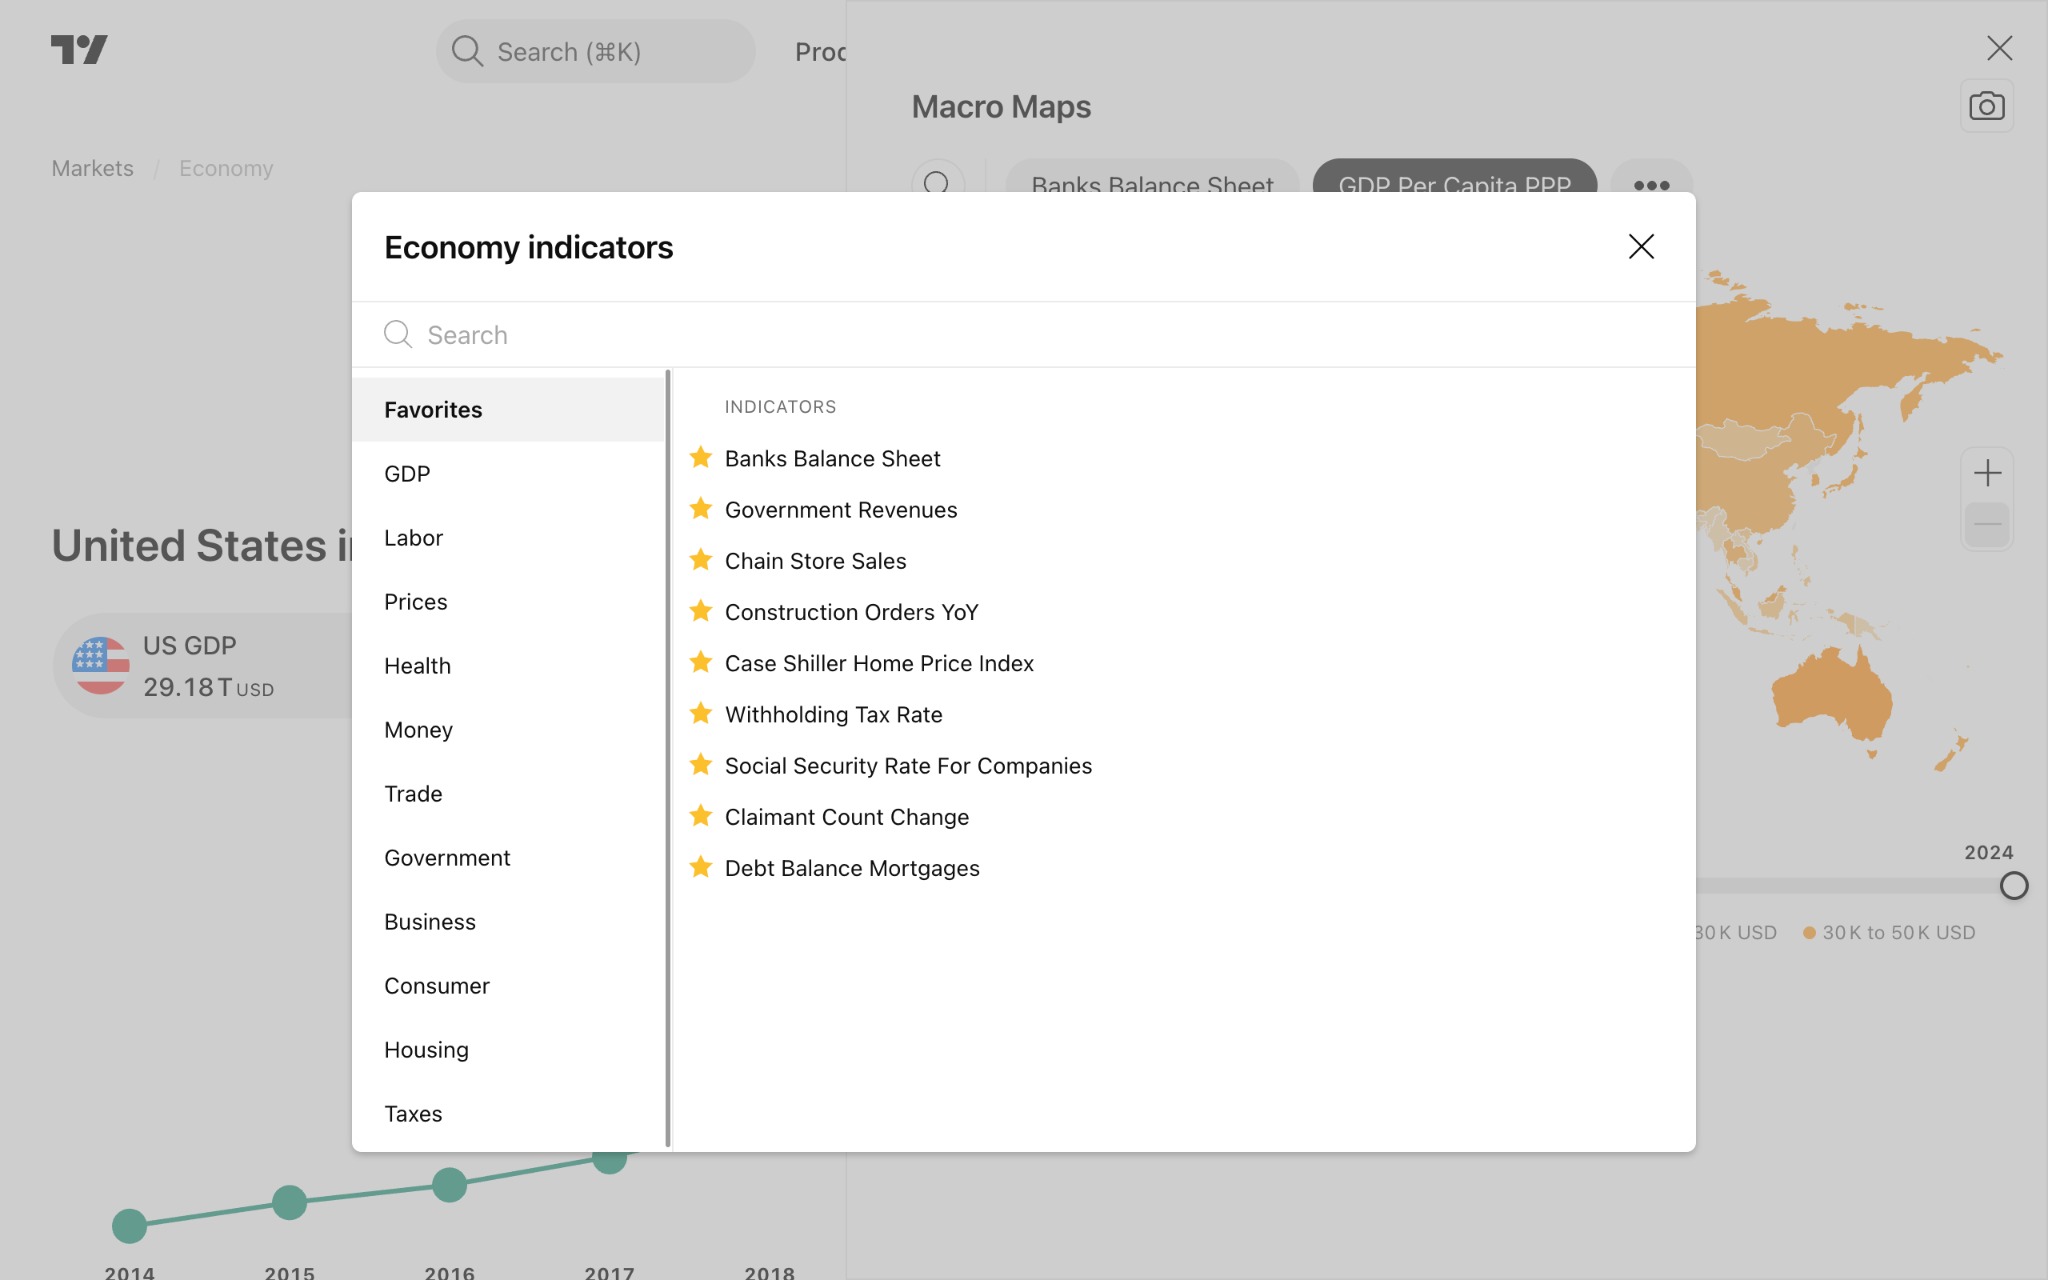
En primer lugar, debe seleccionar los indicadores con los que desea comenzar su análisis. En la esquina superior izquierda, haga clic en el icono de la lupa para acceder a todos los indicadores disponibles. O simplemente elija entre los que ya se muestran en la parte superior de los mapas.
Marcar los indicadores como favoritos le permite cambiar rápidamente entre ellos y configurar los mapas según su análisis.
Para cambiar los datos, simplemente arrastre el control deslizante en la parte inferior. Debajo de él, verá los criterios que determinan la codificación por colores de los países según valores específicos. Estos criterios se ajustarán automáticamente cada vez que cambie el período de tiempo.
Ah, y una cosa más sobre la economía global...
Si necesita datos más diversos sobre la economía mundial, nuestras páginas de mercado ofrecen acceso a mapas de calor de indicadores económicos, las noticias más importantes de los usuarios de TradingView, las últimas noticias del mercado y otra información valiosa que puede ayudarle a comprender los mercados desde múltiples perspectivas y a tomar decisiones de trading más informadas.
Lea también:
- Gráficos fundamentales: aprenda a representar gráficamente métricas financieras
- Calendario de TradingView: explore los principales acontecimientos económicos y corporativos
- Indicadores TradingView: Pasos sencillos para empezar
- Introducción al análisis fundamental en TradingView
- ¿Qué son los Datos Financieros?