YTD % / Visible Range % TableAUTHOR: Brandon Gum
DATE: 2026-01-03
// PURPOSE:
// Calculates price-range metrics based on the *currently visible*
// portion of the chart. Intended for table-based UI display where
// values must be stable and evaluated only on the last bar.
//
// Originally based on Jeff Sun's ADR price data table.
//
// METRICS RETURNED:
// - Visible High
// - Visible Low
// - Visible % Range = (Visible High - Visible Low) / Visible Low
// - Visible ATRs = (Visible High - Visible Low) / ATR
//
// IMPLEMENTATION NOTES:
// - Logic executes ONLY on barstate.islast to avoid state corruption.
// - Visible range is recomputed atomically using a backward loop
// bounded by chart.left_visible_bar_time.
// - Avoids var-based accumulation and bar-by-bar resets, which are
// unreliable when visible window changes.
// - ATR is evaluated at the current bar (not averaged over range).
//
// ASSUMPTIONS / LIMITATIONS:
// - Uses chart-visible time boundaries supplied by TradingView.
// - Loop upper bound must be sufficiently large to cover max
// expected visible bars.
// - Intended for display purposes, not signal generation.
//
// SIDE EFFECTS:
// - None. No plots, no drawings, no state persistence.
Ytd

First X Days Of A YearFirst X-Day Indicator
Overview
The "First X-Day Indicator" is a powerful tool to visualize and analyze market sentiment during the crucial first trading days of each new year. It provides immediate visual feedback on whether the year is starting with positive or negative momentum compared to the previous year's close, a concept often related to market theories like the "January Effect" or the "First Five Days Rule."
The indicator is designed to be clean, intuitive, and fully customizable to fit your charting style.
Key Features
Yearly Baseline: Automatically draws a horizontal line at the previous year's closing price. This line serves as a clear 0% reference for the current year's performance.
Dynamic Background Coloring: For a user-defined number of days at the start of the year, the chart background is colored daily. Green indicates the close is above the previous year's close, while red indicates it's below.
Final Performance Symbol: At the end of the analysis period (e.g., on the 5th day), a single summary symbol (like 👍 or 👎) appears. This symbol represents the final performance outcome of the initial trading period.
Settings & Customization
You have full control over all visual elements:
Analysis Period: Define exactly how many days at the start of the year you want to analyze (e.g., 3, 5, or 10 days).
Line Customization: Fully control the yearly baseline's appearance. You can change its color, width, and style (Solid, Dashed, or Dotted) or hide it completely.
Symbol Customization: Choose any character or emoji for the positive and negative performance symbols. You can also adjust their size (Small, Normal, Large) or hide them.
Background Control: Enable or disable the daily background coloring and select your preferred custom colors for positive and negative days.

Yearly CandlesPlots yearly candles from monthly candles data. This indicator could also be used to view yearly candles of those symbols for which candlesticks are not available in TradingView (for e.g., ECONOMICS:USINTR , ECONOMICS:USIRYY , ECONOMICS:USWG etc)
As these are not out of the box candles they do have these shortcomings -
Last candle's data is not available in status line, a separate label lists OHLC and change details near its close level
The very first candle's width may vary based on how much data is available for that year
Works only with monthly timeframe
Only those indicators that can be added on other indicators can be applied, however, they may still not work as intended as this still technically is a monthly chart!

Year to Date (YTD) Moving averagePretty simple script, this is the Year to Date simple moving average.

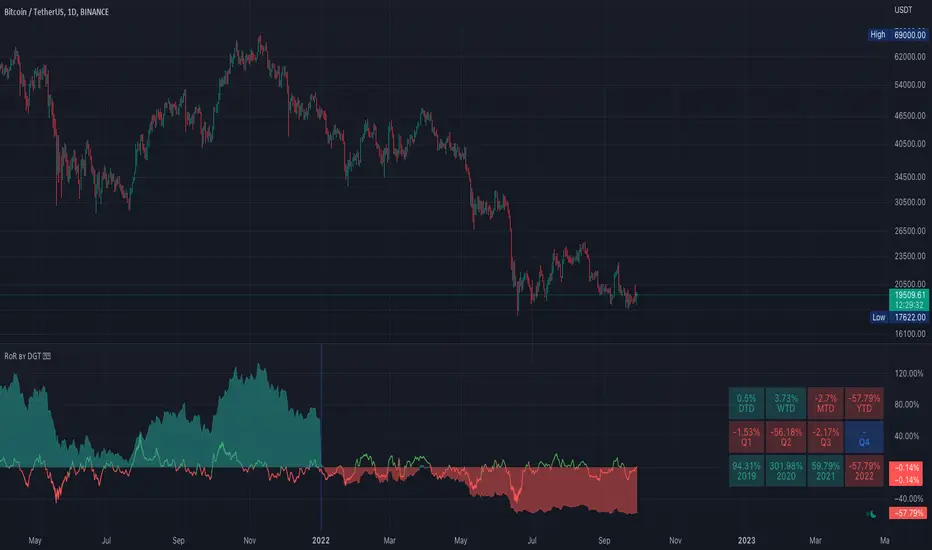
Rate of Return (RoR) by DGTA rate of return (RoR) is the net gain or loss of an investment over a specified time period, expressed as a percentage of the investment’s initial cost