[GYTS] Volatility Toolkit Volatility Toolkit
🌸 Part of GoemonYae Trading System (GYTS) 🌸
🌸 --------- INTRODUCTION --------- 🌸
💮 What is Volatility Toolkit?
Volatility Toolkit is a comprehensive volatility analysis indicator featuring academically-grounded range-based estimators. Unlike simplistic measures like ATR, these estimators extract maximum information from OHLC data — resulting in estimates that are 5-14× more statistically efficient than traditional close-to-close methods.
The indicator provides two configurable estimator slots, weighted aggregation, adaptive threshold detection, and regime identification — all with flexible smoothing options via
GYTS FiltersToolkit integration.
💮 Why Use This Indicator?
Standard volatility measures (like simple standard deviation) are highly inefficient, requiring large amounts of data to produce stable estimates. Academic research has shown that range-based estimators extract far more information from the same price data:
• Statistical Efficiency — Yang-Zhang achieves up to 14× the efficiency of close-to-close variance, meaning you can achieve the same estimation accuracy with far fewer bars
• Drift Independence — Rogers-Satchell and Yang-Zhang correctly isolate variance even in strongly trending markets where simpler estimators become biased
• Gap Handling — Yang-Zhang properly accounts for overnight gaps, critical for equity markets
• Regime Detection — Built-in threshold modes identify when volatility enters elevated or suppressed states
↑ Overview showing Yang-Zhang volatility with dynamic threshold bands and regime background colouring
🌸 --------- HOW IT WORKS --------- 🌸
💮 Core Concept
The toolkit groups volatility estimators by their output scale to ensure valid comparisons and aggregations:
• Log-Return Scale (σ) — Close-to-Close, Parkinson, Garman-Klass, Rogers-Satchell, Yang-Zhang. These are comparable and can be aggregated. Annualisable via √(periods_per_year) scaling.
• Price Unit Scale ($) — ATR. Measures volatility in absolute price terms, directly usable for stop-loss placement.
• Percentage Scale (%) — Chaikin Volatility. Measures the rate of change of the trading range — whether volatility is expanding or contracting.
Only estimators with the same scale can be meaningfully compared or aggregated. The indicator enforces this and warns when mixing incompatible scales.
💮 Range-Based Estimator Overview
Range-based estimators utilise High, Low, Open, and Close prices to extract significantly more information about the underlying diffusion process than close-only methods:
• Parkinson (1980) — Uses High-Low range. ~5× more efficient than close-to-close. Assumes zero drift.
• Garman-Klass (1980) — Incorporates Open and Close. ~7.4× more efficient. Assumes zero drift, no gaps.
• Rogers-Satchell (1991) — Drift-independent. Superior in trending markets where Parkinson/GK become biased.
• Yang-Zhang (2000) — Composite estimator handling both drift and overnight gaps. Up to 14× more efficient.
💮 Theoretical Background
• Parkinson, M. (1980). The Extreme Value Method for Estimating the Variance of the Rate of Return. Journal of Business, 53 (1), 61–65. DOI
• Garman, M.B. & Klass, M.J. (1980). On the Estimation of Security Price Volatilities from Historical Data. Journal of Business, 53 (1), 67–78. DOI
• Rogers, L.C.G. & Satchell, S.E. (1991). Estimating Variance from High, Low and Closing Prices. Annals of Applied Probability, 1 (4), 504–512. DOI
• Yang, D. & Zhang, Q. (2000). Drift-Independent Volatility Estimation Based on High, Low, Open, and Close Prices. Journal of Business, 73 (3), 477–491. DOI
🌸 --------- KEY FEATURES --------- 🌸
💮 Feature Reference
Estimators (8 options across 3 scale groups):
• Close-to-Close — Classical benchmark using closing prices only. Least efficient but useful as baseline. Log-return scale.
• Parkinson — Range-based (High-Low), ~5× more efficient than close-to-close. Assumes zero drift. Log-return scale.
• Garman-Klass — OHLC-optimised, ~7.4× more efficient. Assumes zero drift, no gaps. Log-return scale.
• Rogers-Satchell — Drift-independent, handles trending markets where Parkinson/GK become biased. Log-return scale.
• Yang-Zhang — Gap-aware composite, most comprehensive (up to 14× efficient). Uses internal rolling variance (unsmoothed). Log-return scale.
• Std Dev — Standard deviation of log returns. Log-return scale.
• ATR — Average True Range in absolute price units. Useful for stop-loss placement. Price unit scale.
• Chaikin — Rate of change of range. Measures volatility expansion/contraction, not level. Percentage scale.
Smoothing Filters (10 options via FiltersToolkit):
• SMA / EMA — Classical moving averages
• Super Smoother (2-Pole / 3-Pole) — Ehlers IIR filter with excellent noise reduction
• Ultimate Smoother (2-Pole / 3-Pole) — Near-zero lag in passband
• BiQuad — Second-order IIR with configurable Q factor
• ADXvma — Adaptive smoothing, flat during ranging periods
• MAMA — MESA Adaptive Moving Average (cycle-adaptive)
• A2RMA — Adaptive Autonomous Recursive MA
Threshold Modes:
• Static — Fixed threshold values you define (e.g., 0.025 annualised)
• Dynamic — Adaptive bands: baseline ± (standard deviation × multiplier)
• Percentile — Threshold at Nth percentile of recent history (e.g., 80th percentile for high)
Visual Features:
• Level-based colour gradient — Line colour shifts with percentile rank (warm = high vol, cool = low vol)
• Fill to zero — Gradient fill intensity proportional to volatility level
• Threshold fills — Intensity-scaled fills when thresholds are breached
• Regime background — Chart background indicates HIGH/NORMAL/LOW volatility state
• Legend table — Displays estimator names, parameters, current values with percentile ranks (P##)
💮 Dual Estimator Slots
Compare two volatility estimators side-by-side. Each slot independently configures:
• Estimator type (8 options across three scale groups)
• Lookback period and smoothing filter
• Colour palette and visual style
This enables direct comparison between estimators (e.g., Yang-Zhang vs Rogers-Satchell) or between different parameterisations of the same estimator.
↑ Yang-Zhang (reddish) and Rogers-Satchell (greenish)
💮 Flexible Smoothing via FiltersToolkit
All estimators (except Yang-Zhang, which uses internal rolling variance) support configurable smoothing through 10 filter types. Using Infinite Impulse Response (IIR) filters instead of SMA avoids the "drop-off artefact" where volatility readings crash when old spikes exit the window.
Example: Same estimator (Parkinson) with different smoothing filters
Add two instances of Volatility Toolkit to your chart:
• Instance 1: Parkinson with SMA smoothing (lookback 14)
• Instance 2: Parkinson with Super Smoother 2-Pole (lookback 14)
Notice how SMA creates sharp drops when volatile bars exit the window, while Super Smoother maintains a gradual transition.
↑ Two Parkinson estimators — SMA (red mono-colour, showing drop-off artefacts) vs Super Smoother (turquoise mono colour, with smooth transitions)
↑ Garman-Klass with BiQuad (orangy) and 2-pole SuperSmoother filters (greenish)
💮 Weighted Aggregation
Combine multiple estimators into a single weighted average. The indicator automatically:
• Validates scale compatibility (only same-scale estimators can be aggregated)
• Normalises weights (so 2:1 means 67%:33%)
• Displays clear warnings when scales differ
Example: Robust volatility estimate
Combine Yang-Zhang (handles gaps) with Rogers-Satchell (handles drift) using equal weights:
• E1: Yang-Zhang (14)
• E2: Rogers-Satchell (14)
• Aggregation: Enabled, weights 1:1
The aggregated line (with "fill to zero" enabled) provides a more robust estimate by averaging two complementary methodologies.
↑ Yang-Zhang + Rogers-Satchell with aggregation line (thicker) showing combined estimate (notice how opening gaps are handled differently)
Example: Trend-weighted aggregation
In strongly trending markets, weight Rogers-Satchell more heavily since it's drift-independent:
• Estimator 1: Garman-Klass (faster, higher weight in ranging)
• Estimator 2: Rogers-Satchell (drift-independent, higher weight in trends)
• Aggregation: weights 1:2 (favours RS during trends)
💮 Adaptive Threshold Detection
Three threshold modes for identifying volatility regime shifts. Threshold breaches are visualised with intensity-scaled fills that grow stronger the further volatility exceeds the threshold.
Example: Dynamic thresholds for regime detection
Configure dynamic thresholds to automatically adapt to market conditions:
• High Threshold Mode: Dynamic (baseline + 2× std dev)
• Low Threshold Mode: Dynamic (baseline - 2× std dev)
• Show threshold fills: Enabled
This creates adaptive bands that widen during volatile periods and narrow during calm periods.
Example: Percentile-based thresholds
Use percentile mode for context-aware regime detection:
• High Threshold Mode: Percentile (96th)
• Low Threshold Mode: Percentile (4th)
• Percentile Lookback: 500
This identifies when volatility enters the top/bottom 4% of its recent distribution.
↑ Different threshold settings, where the dynamic and percentile methods show adaptive bands that widen during volatile periods, with fill intensity varying by breach magnitude. Regime detection (see next) is enabled too.
💮 Regime Background Colouring
Optional background colouring indicates the current volatility regime:
• High Volatility — Warm/alert background colour
• Normal — No background (neutral)
• Low Volatility — Cool/calm background colour
Select which source (Estimator 1, Estimator 2, or Aggregation) drives the regime display.
Example: Regime filtering for trade decisions
Use regime background to filter trading signals from other indicators:
• Regime Source: Aggregation
• Background Transparency: 90 (subtle)
When the background shows HIGH volatility (warm), consider tighter stops. When LOW (cool), watch for breakout setups.
↑ Regime background emphasis for breakout strategies. Note the interesting A2RMA smoothing for this case.
🌸 --------- USAGE GUIDE --------- 🌸
💮 Getting Started
1. Add the indicator to your chart
2. Estimator 1 defaults to Yang-Zhang (14) — the most comprehensive estimator for gapped markets
3. Keep "Annualise Volatility" enabled to express values in standard annualised form
4. Observe the legend table for current values and percentile ranks (P##). Hover over the table cells to see a little more info in the tooltip.
💮 Choosing an Estimator
• Trending equities with gaps — Yang-Zhang. Handles both drift and overnight gaps optimally.
• Crypto (24/7 trading) — Rogers-Satchell. Drift-independent without Yang-Zhang's multi-period lag.
• Ranging markets — Garman-Klass or Parkinson. Simpler, no drift adjustment needed.
• Price-based stops — ATR. Output in price units, directly usable for stop distances.
• Regime detection — Combine any estimator with threshold modes enabled.
💮 Interpreting Output
• Value (P##) — The volatility reading with percentile rank. "0.1523 (P75)" means 0.1523 annualised volatility at the 75th percentile of recent history.
• Colour gradient — Warmer colours = higher percentile (elevated volatility), cooler colours = lower percentile.
• Threshold fills — Intensity indicates how far beyond the threshold the current reading is.
• ⚠️ HIGH / 🔻 LOW — Table indicators when thresholds are breached.
🌸 --------- ALERTS --------- 🌸
💮 Direction Change Alerts
• Estimator 1/2 direction change — Triggers when volatility inflects (rising to falling or vice versa)
💮 Cross Alerts
• E1 crossed E2 — Triggers when the two estimator lines cross
💮 Threshold Alerts
• E1/E2/Aggr High Volatility — Triggers when volatility breaches the high threshold
• E1/E2/Aggr Low Volatility — Triggers when volatility falls below the low threshold
💮 Regime Change Alerts
• E1/E2/Aggr Regime Change — Triggers when the volatility regime transitions (High ↔ Normal ↔ Low)
🌸 --------- LIMITATIONS --------- 🌸
• Drift bias in Parkinson/GK — These estimators overestimate variance in trending conditions. Switch to Rogers-Satchell or Yang-Zhang for trending markets.
• Yang-Zhang minimum lookback — Requires at least 2 bars (enforced internally). Cannot produce instantaneous readings like other estimators.
• Flat candles — Single-tick bars produce near-zero variance readings. Use higher timeframes for illiquid assets.
• Discretisation bias — Estimates degrade when ticks-per-bar is very small. Consider higher timeframes for thinly traded instruments.
• Scale mixing — Different scale groups (log-return, price unit, percentage) cannot be meaningfully compared or aggregated. The indicator warns but does not prevent display.
🌸 --------- CREDITS --------- 🌸
💮 Academic Sources
• Parkinson, M. (1980). The Extreme Value Method for Estimating the Variance of the Rate of Return. Journal of Business, 53 (1), 61–65. DOI
• Garman, M.B. & Klass, M.J. (1980). On the Estimation of Security Price Volatilities from Historical Data. Journal of Business, 53 (1), 67–78. DOI
• Rogers, L.C.G. & Satchell, S.E. (1991). Estimating Variance from High, Low and Closing Prices. Annals of Applied Probability, 1 (4), 504–512. DOI
• Yang, D. & Zhang, Q. (2000). Drift-Independent Volatility Estimation Based on High, Low, Open, and Close Prices. Journal of Business, 73 (3), 477–491. DOI
• Wilder, J.W. (1978). New Concepts in Technical Trading Systems . Trend Research.
💮 Libraries Used
• VolatilityToolkit Library — Range-based estimators, smoothing, and aggregation functions
• FiltersToolkit Library — Advanced smoothing filters (Super Smoother, Ultimate Smoother, BiQuad, etc.)
• ColourUtilities Library — Colour palette management and gradient calculations
Yangzhang

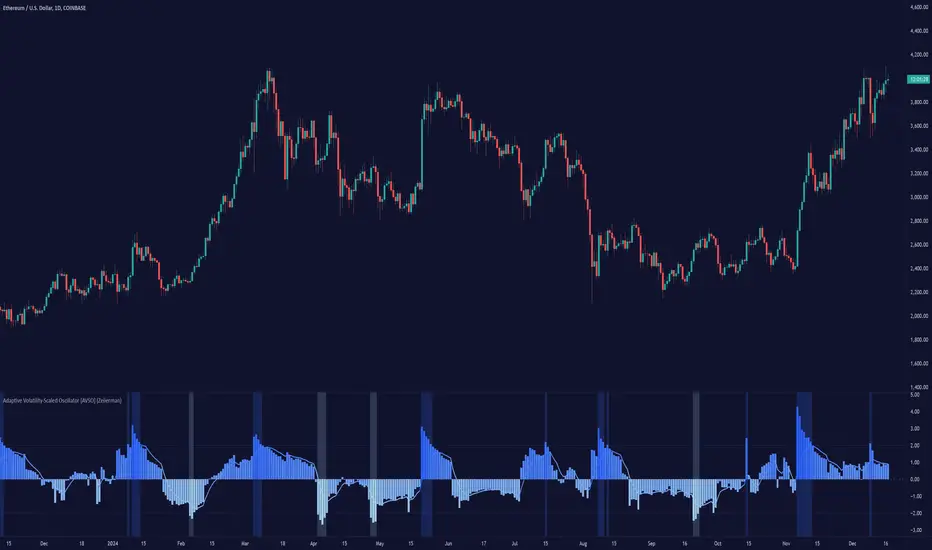
Adaptive Volatility-Scaled Oscillator [AVSO] (Zeiierman)█ Overview
The Adaptive Volatility-Scaled Oscillator (AVSO) is a dynamic trading indicator that measures and visualizes volatility-adjusted market behavior. By scaling various metrics (such as volume, price changes, standard deviation, ATR, and Yang-Zhang volatility) and applying adaptive smoothing, AVSO helps traders identify market conditions where volatility deviates significantly from the norm.
This indicator uses standardized scaling (Z-Score logic) to highlight periods of abnormally high or low volatility relative to recent history. With gradient coloring and clear volatility zones, AVSO provides a visually intuitive way to analyze market volatility and adapt trading strategies accordingly.
█ How It Works
⚪ Scaling Metrics: The indicator scales user-selected metrics (e.g., volume, ATR, standard deviation) relative to the market and price, providing a standardized volatility measure.
⚪ Z-Score Standardization: The scaled metric is normalized using a Z-Score to measure how far current volatility deviates from its recent mean.
Positive Z-Score: Above-average volatility.
Negative Z-Score: Below-average volatility.
⚪ Adaptive Smoothing: An Adaptive EMA smooths the Z-Score, dynamically adjusting its length based on the strength of the volatility. Stronger deviations result in shorter smoothing, increasing responsiveness.
█ Unique Feature: Yang-Zhang Volatility
The Yang-Zhang volatility estimator sets this indicator apart by providing a more robust and accurate measure of volatility compared to traditional methods like ATR or standard deviation.
⚪ What Makes Yang-Zhang Volatility Unique?
Comprehensive Calculation: It combines overnight price gaps (log returns from the previous close to the current open) and intraday price movements (high, low, and close).
Accurate for Gapped Markets: Traditional volatility measures can misrepresent price movement when significant gaps occur between sessions. Yang-Zhang accounts for these gaps, making it highly reliable for assets prone to overnight price jumps, such as stocks, cryptocurrencies, and futures.
Adaptable to Real Market Conditions : By including both close-to-open returns and intraday volatility, it provides a balanced and adaptive measure that captures the full volatility picture.
⚪ Why This Matters to Traders
Better Volatility Insights: Yang-Zhang offers a clearer view of true market volatility, especially in markets with price gaps or uneven trading sessions.
Improved Trade Timing: By identifying volatility spikes and calm periods more effectively, traders can time their entries and exits with greater confidence.
█ How to Use
Identify High and Low Volatility
A high Z-Score (>2) indicates significant market volatility. This can signal momentum-driven moves, breakouts, or areas of increased risk.
A low Z-Score (<-2) suggests low volatility or a calm market environment. This often occurs before a potential breakout or reversal.
Trade Signals
High Volatility Zones (background highlight): Monitor for potential breakouts, trend continuations, or reversals.
Low Volatility Zones: Anticipate range-bound conditions or upcoming volatility spikes.
█ Settings
Source: Select the price source for scaling calculations (close, high, low, open).
Metric Measure: Choose the volatility measure:
Volume: Scales raw volume.
Close: Uses closing price changes.
Standard Deviation: Price dispersion.
ATR: Average True Range.
Yang: Yang-Zhang volatility estimate.
Bars to Analyze: Number of historical bars used to calculate the mean and standard deviation of the scaled metric.
ATR / Standard Deviation Period: Lookback period for ATR or Standard Deviation calculation.
Yang Volatility Period: Period for the Yang-Zhang volatility estimator.
Smoothing Period: Base smoothing length for the adaptive smoothing line.
-----------------
Disclaimer
The information contained in my Scripts/Indicators/Ideas/Algos/Systems does not constitute financial advice or a solicitation to buy or sell any securities of any type. I will not accept liability for any loss or damage, including without limitation any loss of profit, which may arise directly or indirectly from the use of or reliance on such information.
All investments involve risk, and the past performance of a security, industry, sector, market, financial product, trading strategy, backtest, or individual's trading does not guarantee future results or returns. Investors are fully responsible for any investment decisions they make. Such decisions should be based solely on an evaluation of their financial circumstances, investment objectives, risk tolerance, and liquidity needs.
My Scripts/Indicators/Ideas/Algos/Systems are only for educational purposes!
[Pandora] Vast Volatility Treasure TroveINTRODUCTION:
Volatility enthusiasts, prepare for VICTORY on this day of July 4th, 2024! This is my "Vast Volatility Treasure Trove," intended mostly for educational purposes, yet these functions will also exhibit versatility when combined with other algorithms to garner statistical excellence. Once again, I am now ripping the lid off of Pandora's box... of volatility. Inside this script is a 'vast' collection of volatility estimators, reflecting the indicators name. Whether you are a seasoned trader destined to navigate financial strife or an eagerly curious learner, this script offers a comprehensive toolkit for a broad spectrum of volatility analysis. Enjoy your journey through the realm of market volatility with this code!
WHAT IS MARKET VOLATILITY?:
Market volatility refers to various fluctuations in the value of a financial market or asset over a period of time, often characterized by occasional rapid and significant deviations in price. During periods of greater market volatility, evolving conditions of prices can move rapidly in either direction, creating uncertainty for investors with results of sharp declines as well as rapid gains. However, market volatility is a typical aspect expected in financial markets that can also present opportunities for informed decision-making and potential benefits from the price flux.
SCRIPT INTENTION:
Volatility is assuredly omnipresent, waxing and waning in magnitude, and some readers have every intention of studying and/or measuring it. This script serves as an all-in-one armada of volatility estimators for TradingView members. I set out to provide a diverse set of tools to analyze and interpret market volatility, offering volatile insights, and aid with the development of robust trading indicators and strategies.
In today's fast-paced financial markets, understanding and quantifying volatility is informative for both seasoned traders and novice investors. This script is designed to empower users by equipping them with a comprehensive suite of volatility estimators. Each function within this script has been meticulously crafted to address various aspects of volatility, from traditional methods like Garman-Klass and Parkinson to more advanced techniques like Yang-Zhang and my custom experimental algorithms.
Ultimately, this script is more than just a collection of functions. It is a gateway to a deeper understanding of market volatility and a valuable resource for anyone committed to mastering the complexities of financial markets.
SCRIPT CONTENTS:
This script includes a variety of functions designed to measure and analyze market volatility. Where applicable, an input checkbox option provides an unbiased/biased estimate. Below is a brief description of each function in the original order they appear as code upon first publish:
Parkinson Volatility - Estimates volatility emphasizing the high and low range movements.
Alternate Parkinson Volatility - Simpler version of the original Parkinson Volatility that I realized.
Garman-Klass Volatility - Estimates volatility based on high, low, open, and close prices using a formula that adjusts for biases in price dynamics.
Rogers-Satchell-Yoon Volatility #1 - Estimates volatility based on logarithmic differences between high, low, open, and close values.
Rogers-Satchell-Yoon Volatility #2 - Similar estimate to Rogers-Satchell with the same result via an alternate formulation of volatility.
Yang-Zhang Volatility - An advanced volatility estimate combining both strengths of the Garman-Klass and Rogers-Satchell estimators, with weights determined by an alpha parameter.
Yang-Zhang (Modified) Volatility - My experimental modification slightly different from the Yang-Zhang formula with improved computational efficiency.
Selectable Volatility - Basic customizable volatility calculation based on the logarithmic difference between selected numerator and denominator prices (e.g., open, high, low, close).
Close-to-Close Volatility - Estimates volatility using the logarithmic difference between consecutive closing prices. Specifically applicable to data sources without open, high, and low prices.
Open-to-Close Volatility - (Overnight Volatility): Estimates volatility based on the logarithmic difference between the opening price and the last closing price emphasizing overnight gaps.
Hilo Volatility - Estimates volatility using a method similar to Parkinson's method, which considers the logarithm of the high and low prices.
Vantage Volatility - My experimental custom 'vantage' method to estimate volatility similar to Yang-Zhang, which incorporates various factors (Alpha, Beta, Gamma) to generate a weighted logarithmic calculation. This may be a volatility advantage or disadvantage, hence it's name.
Schwert Volatility - Estimates volatility based on arithmetic returns.
Historical Volatility - Estimates volatility considering logarithmic returns.
Annualized Historical Volatility - Estimates annualized volatility using logarithmic returns, adjusted for the number of trading days in a year.
If I omitted any other known varieties, detailed requests for future consideration can be made below for their inclusion into this script within future versions...
BONUS ALGORITHMS:
This script also includes several experimental and bonus functions that push the boundaries of volatility analysis as I understand it. These functions are designed to provide additional insights and also are my ideal notions for traders looking to explore other methods of volatility measurement.
VOLATILITY APPLICATIONS:
Volatility estimators serve a common role across various facets of trading and financial analysis, offering insights into market behavior. These tools are already in instrumental with enhancing risk management practices by providing a deeper understanding of market dynamics and the inherent uncertainty in asset prices. With volatility estimators, traders can effectively quantifying market risk and adjust their strategies accordingly, optimizing portfolio performance and mitigating potential losses. Additionally, volatility estimations may serve as indication for detecting overbought or oversold market conditions, offering probabilistic insights that could inform strategic decisions at turning points. This script
distinctly offers a variety of volatility estimators to navigate intricate financial terrains with informed judgment to address challenges of strategic planning.
CODE REUSE:
You don't have to ask for my permission to use/reuse these functions in your published scripts, simply because I have better things to do than answer requests for the reuse of these functions.
Notice: Unfortunately, I will not provide any integration support into member's projects at all. I have my own projects that require way too much of my day already.

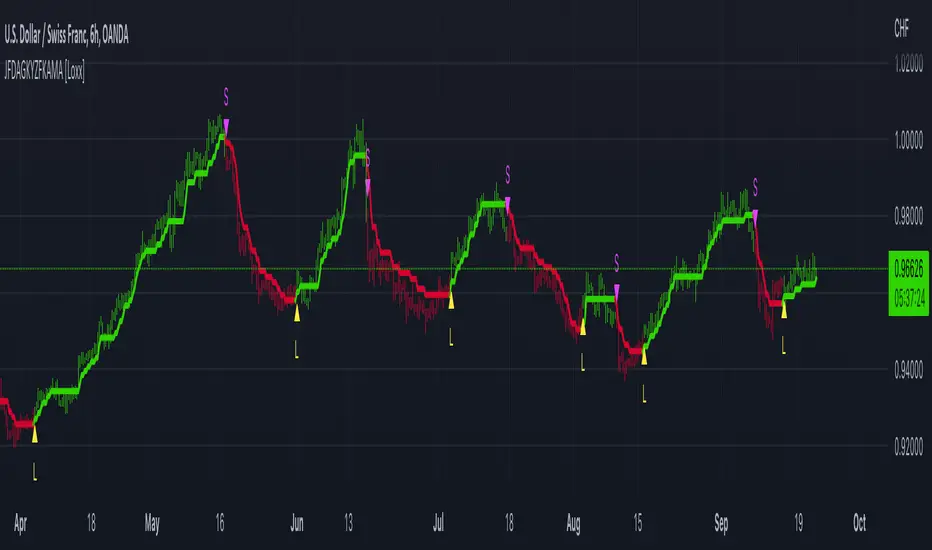
GKYZ-Filtered, Non-Linear Regression MA [Loxx]GKYZ-Filtered, Non-Linear Regression MA is a Non-Linear Regression of price moving average. Use this as you would any other moving average. This also includes a Garman-Klass-Yang-Zhang Historical Volatility Filter to reduce noise.
What is Non-Linear Regression?
In statistics, nonlinear regression is a form of regression analysis in which observational data are modeled by a function which is a nonlinear combination of the model parameters and depends on one or more independent variables. The data are fitted by a method of successive approximations.
What is Garman-Klass-Yang-Zhang Historical Volatility?
Yang and Zhang derived an extension to the Garman Klass historical volatility estimator that allows for opening jumps. It assumes Brownian motion with zero drift. This is currently the preferred version of open-high-low-close volatility estimator for zero drift and has an efficiency of 8 times the classic close-to-close estimator. Note that when the drift is nonzero, but instead relative large to the volatility , this estimator will tend to overestimate the volatility . The Garman-Klass-Yang-Zhang Historical Volatility calculation is as follows:
GKYZHV = sqrt((Z/n) * sum((log(open(k)/close( k-1 )))^2 + (0.5*(log(high(k)/low(k)))^2) - (2*log(2) - 1)*(log(close(k)/open(2:end)))^2))
Included
Alerts
Signals
Loxx's Expanded Source Types
Bar coloring
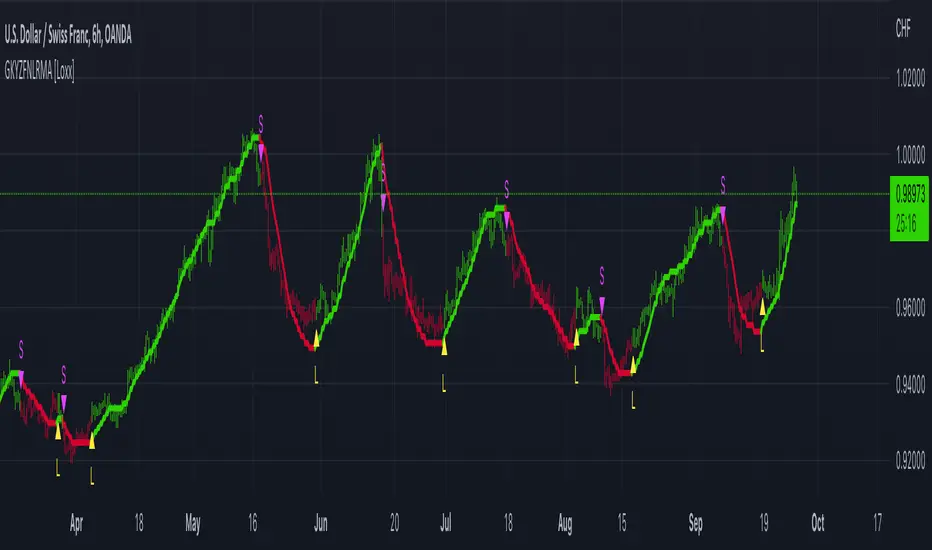
JFD-Adaptive, GKYZ-Filtered KAMA [Loxx]JFD-Adaptive, GKYZ-Filtered KAMA is a Kaufman Adaptive Moving Average with the option to make it Jurik Fractal Dimension Adaptive. This also includes a Garman-Klass-Yang-Zhang Historical Volatility Filter to reduce noise.
What is KAMA?
Developed by Perry Kaufman, Kaufman's Adaptive Moving Average ( KAMA ) is a moving average designed to account for market noise or volatility . KAMA will closely follow prices when the price swings are relatively small and the noise is low. KAMA will adjust when the price swings widen and follow prices from a greater distance. This trend-following indicator can be used to identify the overall trend, time turning points and filter price movements.
What is Jurik Fractal Dimension?
There is a weak and a strong way to measure the random quality of a time series.
The weak way is to use the random walk index ( RWI ). You can download it from the Omega web site. It makes the assumption that the market is moving randomly with an average distance D per move and proposes an amount the market should have changed over N bars of time. If the market has traveled less, then the action is considered random, otherwise it's considered trending.
The problem with this method is that taking the average distance is valid for a Normal (Gaussian) distribution of price activity. However, price action is rarely Normal, with large price jumps occuring much more frequently than a Normal distribution would expect. Consequently, big jumps throw the RWI way off, producing invalid results.
The strong way is to not make any assumption regarding the distribution of price changes and, instead, measure the fractal dimension of the time series. Fractal Dimension requires a lot of data to be accurate. If you are trading 30 minute bars, use a multi-chart where this indicator is running on 5 minute bars and you are trading on 30 minute bars.
What is Garman-Klass-Yang-Zhang Historical Volatility?
Yang and Zhang derived an extension to the Garman Klass historical volatility estimator that allows for opening jumps. It assumes Brownian motion with zero drift. This is currently the preferred version of open-high-low-close volatility estimator for zero drift and has an efficiency of 8 times the classic close-to-close estimator. Note that when the drift is nonzero, but instead relative large to the volatility , this estimator will tend to overestimate the volatility . The Garman-Klass-Yang-Zhang Historical Volatility calculation is as follows:
GKYZHV = sqrt((Z/n) * sum((log(open(k)/close( k-1 )))^2 + (0.5*(log(high(k)/low(k)))^2) - (2*log(2) - 1)*(log(close(k)/open(2:end)))^2))
Included
Alerts
Signals
Loxx's Expanded Source Types
Bar coloring
RSI-Adaptive, GKYZ-Filtered DEMA [Loxx]RSI-Adaptive, GKYZ-Filtered DEMA is a Garman-Klass-Yang-Zhang Historical Volatility Filtered, RSI-Adaptive Double Exponential Moving Average. This is an experimental indicator. The way this is calculated is by turning RSI into an alpha value that is then injected into a DEMA function to output price. Price is then filtered using GKYZ Historical volatility. This process of creating an alpha out of RSI is only relevant to EMA-based moving averages that use an alpha value for it's calculation.
What is Garman-Klass-Yang-Zhang Historical Volatility?
Yang and Zhang derived an extension to the Garman Klass historical volatility estimator that allows for opening jumps. It assumes Brownian motion with zero drift. This is currently the preferred version of open-high-low-close volatility estimator for zero drift and has an efficiency of 8 times the classic close-to-close estimator. Note that when the drift is nonzero, but instead relative large to the volatility , this estimator will tend to overestimate the volatility . The Garman-Klass-Yang-Zhang Historical Volatility calculation is as follows:
GKYZHV = sqrt((Z/n) * sum((log(open(k)/close( k-1 )))^2 + (0.5*(log(high(k)/low(k)))^2) - (2*log(2) - 1)*(log(close(k)/open(2:end)))^2))
Included
Alerts
Signals
Loxx's Expanded Source Types
Bar coloring

Garman-Klass-Yang-Zhang Historical Volatility Bands [Loxx]Garman-Klass-Yang-Zhang Historical Volatility Bands are constructed using:
Average as the middle line.
Upper and lower bands using the Garman-Klass-Yang-Zhang Historical Volatility Bands for bands calculation.
What is Garman-Klass-Yang-Zhang Historical Volatility?
Yang and Zhang derived an extension to the Garman Klass historical volatility estimator that allows for opening jumps. It assumes Brownian motion with zero drift. This is currently the preferred version of open-high-low-close volatility estimator for zero drift and has an efficiency of 8 times the classic close-to-close estimator. Note that when the drift is nonzero, but instead relative large to the volatility, this estimator will tend to overestimate the volatility. The Garman-Klass-Yang-Zhang Historical Volatility calculation is as follows:
GKYZHV = sqrt((Z/n) * sum((log(open(k)/close(k-1)))^2 + (0.5*(log(high(k)/low(k)))^2) - (2*log(2) - 1)*(log(close(k)/open(2:end)))^2))
The color of the middle line, unlike the bands colors, has 3 colors. When colors of the bands are the same, then the middle line has the same color, otherwise it's white.
Included
Alerts
Signals
Loxx's Expanded Source Types
Bar coloring
Related Indicators
Garman & Klass Estimator Historical Volatility Bands

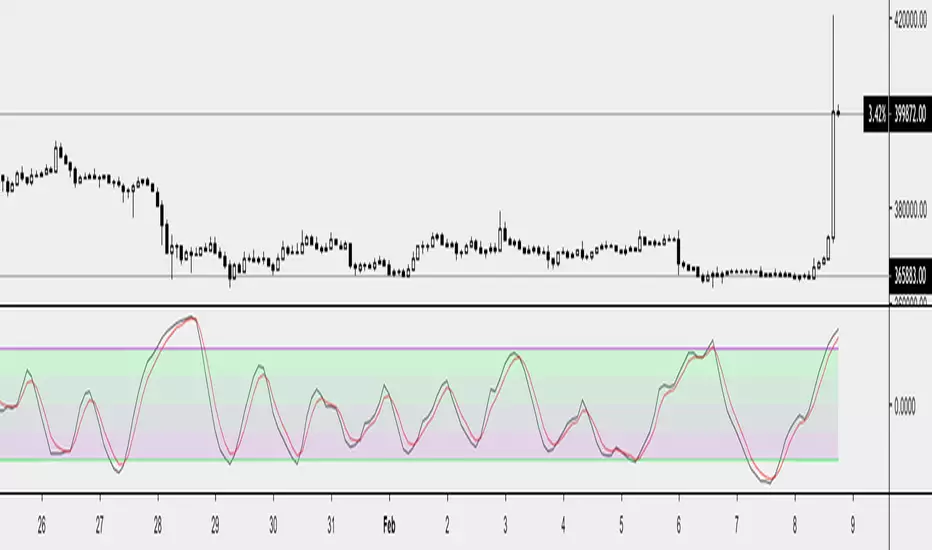
Yang & Zheng Extension of Garman & KlassFirst off, a huge thank you to the following people:
theheirophant: www.tradingview.com
alexgrover: www.tradingview.com
NGBaltic: www.tradingview.com
This is the Yang & Zhang extension of Garman & Klass. The equation was modified to include the logarithm of the open price divided by the preceding close price. As a result, this function uses the open, high, low and close prices to estimate volatility. This modification allows the volatility estimator to account for the opening jumps, but as the original function, it assumes that the underlying follows a Brownian motion with zero drift (the historical mean return should be equal to zero). This estimator tends to overestimate the volatility when the drift is different from zero, however, for a zero drift motion, this estimator has an efficiency of eight times the classic close-to-close estimator (standard deviation).
This script allows you to transform the volatility reading. The intention of this is to be able to compare volatility across different assets and timeframes. Having a relative reading of volatility also allows you to better gauge volatility within the context of current market conditions.
For the signal lie I chose a repulsion moving average to remove choppy crossovers of the estimator and the signal. This may have been a mistake, so in the near-future I might update so that the MA can be selected. Let me know if you have any opinions either way.
References
www.rdocumentation.org
www.quantshare.com
Want to Learn?
If you'd like the opportunity to learn Pine but you have difficulty finding resources to guide you, take a look at this rudimentary list: docs.google.com
The list will be updated in the future as more people share the resources that have helped, or continue to help, them. Follow me on Twitter to keep up-to-date with the growing list of resources.
Suggestions or Questions?
Don't even kinda hesitate to forward them to me. My (metaphorical) door is always open.
OHLC Volatility Estimators by @Xel_arjonaDISCLAIMER:
The Following indicator/code IS NOT intended to be a formal investment advice or recommendation by the author, nor should be construed as such. Users will be fully responsible by their use regarding their own trading vehicles/assets.
The embedded code and ideas within this work are FREELY AND PUBLICLY available on the Web for NON LUCRATIVE ACTIVITIES and must remain as is by Creative-Commons as TradingView's regulations. Any use, copy or re-use of this code should mention it's origin as it's authorship.
WARNING NOTICE!
THE INCLUDED FUNCTION MUST BE CONSIDERED AS DEBUGING CODE The models included in the function have been taken from openly sources on the web so they could have some errors as in the calculation scheme and/or in it's programatic scheme. Debugging are welcome.
WHAT'S THIS?
Here's a full collection of candle based (compressed tick) Volatility Estimators given as a function, openly available for free, it can print IMPLIED VOLATILITY by an external symbol ticker like INDEX:VIX.
Models included in the volatility calculation function:
CLOSE TO CLOSE: This is the classic estimator by rule, sometimes referred as HISTORICAL VOLATILITY and is the must common, accepted and widely used out there. Is based on traditional Standard Deviation method derived from the logarithm return of current close from yesterday's.
ELASTIC WEIGHTED MOVING AVERAGE: This estimator has been used by RiskMetriks®. It's calculation is based on an ElasticWeightedMovingAverage Standard Deviation method derived from the logarithm return of current close from yesterday's. It can be viewed or named as an EXPONENTIAL HISTORICAL VOLATILITY model.
PARKINSON'S: The Parkinson number, or High Low Range Volatility, developed by the physicist, Michael Parkinson, in 1980 aims to estimate the Volatility of returns for a random walk using the high and low in any particular period. IVolatility.com calculates daily Parkinson values. Prices are observed on a fixed time interval. n=10, 20, 30, 60, 90, 120, 150, 180 days.
ROGERS-SATCHELL: The Rogers-Satchell function is a volatility estimator that outperforms other estimators when the underlying follows a Geometric Brownian Motion (GBM) with a drift (historical data mean returns different from zero). As a result, it provides a better volatility estimation when the underlying is trending. However, this Rogers-Satchell estimator does not account for jumps in price (Gaps). It assumes no opening jump. The function uses the open, close, high, and low price series in its calculation and it has only one parameter, which is the period to use to estimate the volatility.
YANG-ZHANG: Yang and Zhang were the first to derive an historical volatility estimator that has a minimum estimation error, is independent of the drift, and independent of opening gaps. This estimator is maximally 14 times more efficient than the close-to-close estimator.
LOGARITHMIC GARMAN-KLASS: The former is a pinescript transcript of the model defined as in iVolatility . The metric used is a combination of the overnight, high/low and open/close range. Such a volatility metric is a more efficient measure of the degree of volatility during a given day. This metric is always positive.
