Kameniczki RSI MASTERKAMENICZKI RSI MASTER is a professional trading indicator based on RSI (Relative Strength Index) with advanced features for precise identification of trading opportunities. The indicator combines classic RSI analysis with intelligent Zig Zag system and smoothing techniques for maximum signal accuracy.
Features:
RSI Analysis with Gradient Display
The indicator displays RSI in the lower panel with color gradient - blue for overbought zones and pink for oversold zones. RSI is calculated with adjustable period (recommended 14 for daily charts, 7-9 for shorter timeframes).
Zig Zag Signal System
Intelligent Zig Zag system generates BUY and SELL signals based on RSI extremes. The system automatically identifies swing points and creates clear visual markings with blue BUY and pink SELL labels.
Smoothing Moving Average
Advanced smoothing techniques supporting SMA, EMA, SMMA, WMA and VWMA. MA is displayed in price chart with dual-color system - blue for rising trend, pink for falling trend.
Bollinger Bands Integration
Optional Bollinger Bands around RSI and price for volatility identification and potential breakouts. Bands automatically adapt to market conditions.
Comprehensive Alert System
Extensive alert system includes Zig Zag signals, RSI levels, MA direction changes, BB touches and combined strong signals for maximum trading accuracy.
Real-Time Trend Analysis
Instant trend identification with priority for actual price direction. System displays current trend (BUY/SELL/WAIT) and risk analysis with visual table.
Risk Management
Automatic volatility and risk level analysis with percentage expression. System identifies high and low risk periods for safer trading.
Recommended Timeframes:
- 1H, 4H, 1D - optimal for swing trading
- 15M, 30M - for day trading
- 1W - for position trading
Success Rate:
- Zig Zag signals: 75-85% accuracy
- Combined strong signals: 80-90% accuracy
- Trend identification: 70-80% accuracy
- Overall system success: 75-85% with proper settings
⚠️ IMPORTANT WARNING: Zig Zag signals may cause repainting on lower timeframes. For live trading, use higher timeframes (15M, 1H+) or wait for signal confirmation to avoid false signals.
The indicator is suitable for all types of traders - from beginners to professionals, with detailed parameter adjustment options according to individual needs.
Análisis de ondas

Jesses 1.2This indicator detects Break of Structure (BOS) using a strict “break-only + one opposite candle to the left” rule. On confirmation, it draws a sticky zone box (orange for BUY, teal for SELL) anchored to the origin candle and extends it until breached. It includes session filtering (Sydney/Tokyo, London, New York in NZ time), optional origin-candle tint with adjustable opacity, and alerts that trigger only when a box is created. Internally it tracks bullish/bearish runs, enforces one-per-reference logic, rotates recent boxes, and freezes active boxes at the daily boundary.

Minute/Hour Sum 3-6-9**Important:** Use Eastern Standard Time (EST) and apply this on the 1-minute timeframe. Check that the minute digits are summing correctly—for example, at 7:45 AM, the indicator should show “9” because 4+5=9. If sums aren’t correct, adjust the timezone offset until they align perfectly.
This Pine Script creates the "Minute/Hour Sum 3-6-9" timing indicator, highlighting candles where the digits of the current minute or hour (depending on the timeframe) add up to 3, 6, or 9—numbers popular in cyclical and vibrational timing concepts like the 3-6-9 pattern.
On intraday charts below 1 hour it sums the digits of the minute, such as 21 which becomes 2+1=3. On hourly or higher charts, it sums the digits of the hour, like 12 which becomes 1+2=3. The indicator plots a label “3,” “6,” or “9” above or below the candle depending on whether it is bearish or bullish. Sum numbers change with direction to visually signal sentiment. You can adjust the timezone offset to align with your local RTH or ICT timing.
In this rhythmic model, the “9” candle is often seen as the entry or decision candle. A “9” sum bar marks the completion of a short intraday cycle. Traders consider the “9” as a potential turning or breakout point a candle where price may reverse, accelerate, or confirm direction after the 3–6 build-up. Typically, traders wait for the “9” label to form, confirm direction, then enter on that candle or the following one.

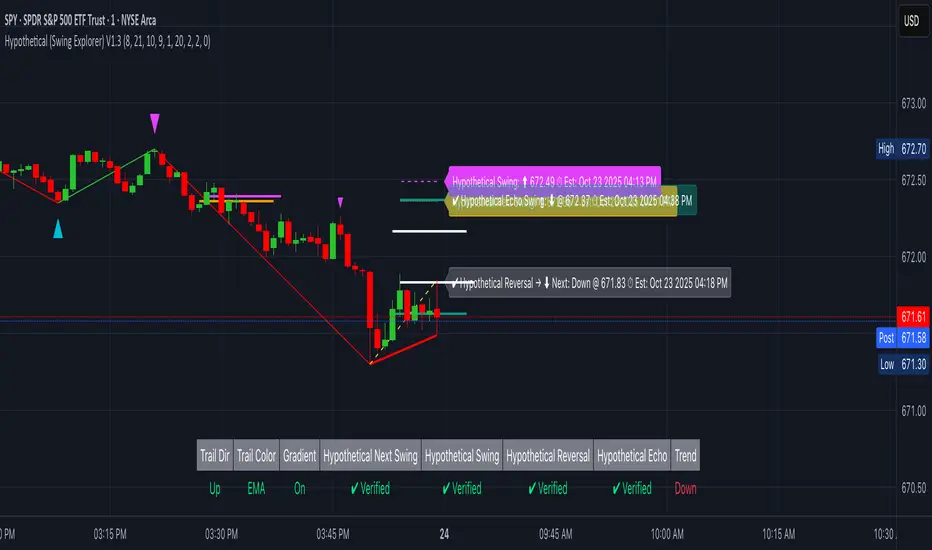
Hypothetical (Swing Explorer)Hypothetical (Swing Explorer) V1.3
Overview
Hypothetical (Swing Explorer) V1.3 is a Pine v6 swing-study visualizer. It confirms extremes using ta.pivothigh/ta.pivotlow and an EMA context filter, then constructs a ZigZag only from verified pivots to avoid repainting. On top, it illustrates four hypothetical marks—Next, Swing, Reversal, and Forward Echo—each with an ETA derived from recent price speed and bar time. It also provides trail lines (verified or developing), an optional Zero-Lag guide from the last extreme, a status table showing hit/pending states, and optional custom candle coloring by leg.
This tool is an illustrative swing explorer.
How it works
Verified Pivots (Non-Repainting):
• Uses ta.pivothigh/ta.pivotlow with symmetric lookbacks.
• Verifies extremes with a trend check (fast vs slow EMA at the pivot bar) to avoid counter-trend “noise.”
• Marks developing vs verified extremes; ZigZag lines are drawn only from verified pivots.
ZigZag Structure & Leg Direction:
•Rolling-window tests (highest/lowest over winLen) flip the swing polarity.
• Lines are drawn using xloc.bar_time so segments remain anchored to bar timestamps.
Trails & Zero-Lag (visual guidance):
• Trail mode can be Verified (solid) or Hypothetical (dashed).
• Trail color can sync to EMA bias or recent price change, with optional gradient tint by relative ATR change.
• Zero-Lag line connects the last verified extreme to live price as a dashed guide.
Hypothetical Targets (with ETA):
• Next Swing: mirrors the last verified leg distance from the most recent extreme.
• Primary Swing: Next Swing plus a small momentum/volatility adjustment.
• Reversal: price distance ≈ average historical swing range, with time ≈ average swing bars.
• Forward Echo: a “two-swings-ahead” projection (≈ 2× avg swing range/bars).
• ETAs derive from recent price speed (EMA of |Δprice|) and bar_time deltas; all targets display Pending → Verified when price tags them.
• Each target type keeps capped line history (FIFO) to prevent clutter.
Status Table & Alerts:
• Table shows Trail Direction, Sync Mode, Gradient state, and Pending/Verified for each hypothetical mark; also prints trend bias (fast vs slow EMA).
• Visual labels update in place; confirmation draws a short solid marker line.
Optional Custom Candles:
• Colors candles by verified leg or (optionally) by developing leg for early visual context.
What it displays
• ZigZag from verified extremes (non-repainting).
• Trail line (solid = verified, dashed = developing) with EMA/price sync and optional gradient.
• Zero-Lag dashed guide from last extreme to current price.
• Hypothetical Next/Swing/Reversal/Echo lines + labels, each with ETA; persistent confirmation lines when hit.
• Status table showing Pending/Verified states and context.
• Optional custom candles colored by active leg.
Why it’s original
• Moves beyond a plain ZigZag by combining:
• Verified-only structure (EMA-filtered pivots),
• A four-stage hypothetical framework (Next/Swing/Reversal/Echo) with time estimates,
• Trail logic that supports developing vs verified states and snap-back handling,
• Zero-Lag visualization tied to the last extreme, and
• Persistent, capped history of projection lines for post-analysis.
These elements create a cohesive swing exploration workflow rather than a single indicator mashup.
Configuration & usage notes
• Trend & Averages: Fast/Slow EMA lengths affect verification.
• Pivots: pivotLookback controls confirmation latency vs strictness.
• Structure: winLen influences flip sensitivity.
• Trails: Choose Hypothetical for earlier (dashed) trail hints; Verified for conservative trails.
• Hypothetical Tools: Toggle each mark; set max lines per type to balance history vs clarity.
• Custom Candles: Enable if you want leg-based candle tints; choose developing mode for earlier flips.
• Performance: The script caps historical lines per type to keep charts responsive.
Limitations & assumptions
• ETAs use recent price speed and average swing bars; these are illustrative and can drift with regime changes.
• Hypothetical Projections are not signals; they’re visual hypotheses grounded in measured past swings.
Legal Disclaimer
This indicator is for informational and educational purposes only—not investment, financial, or trading advice. Past performance does not guarantee future results; trading involves risk of loss. Provided “as is” with no warranties. Consult a qualified professional before decisions. By using it, you assume all risk and agree to this disclaimer.
ten2 Cipher v.1Created and built by ten2crypto
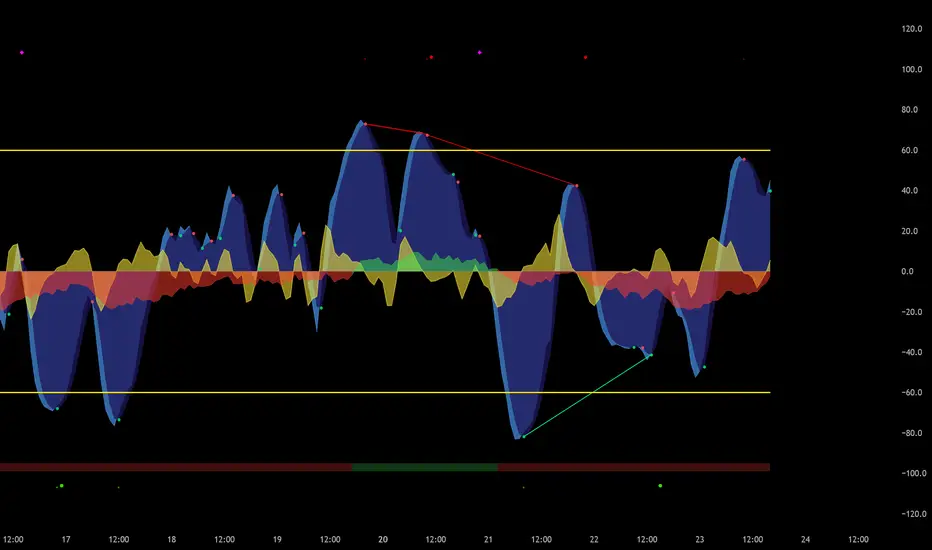
This is not just another "Market Cipher" clone. This is my personal, ground-up build of a comprehensive momentum and divergence toolkit, designed to provide a deeper, more nuanced view of the market. The ten2 Cipher Divergence Engine combines the best aspects of classic momentum oscillators with a powerful, multi-layered divergence system.
This indicator was built for my own trading and is now being shared with the community.
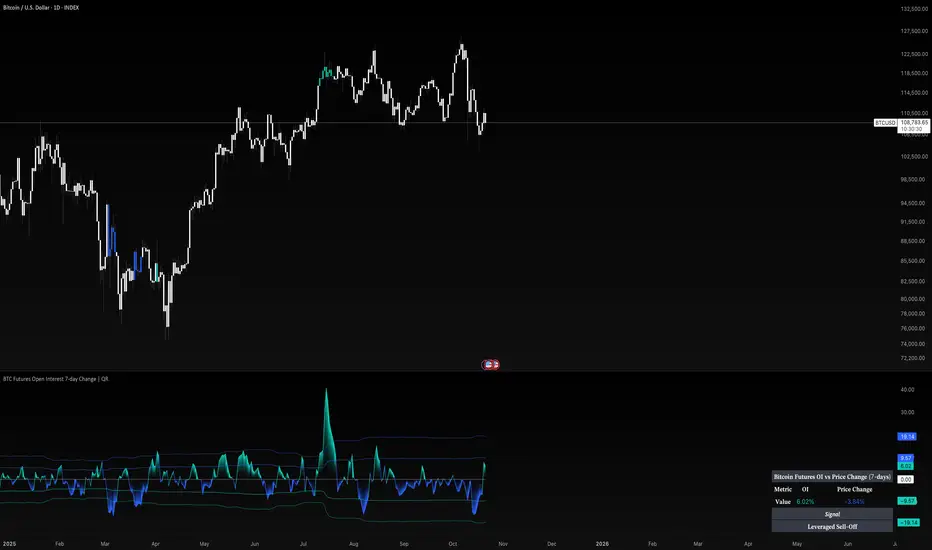
BTC Futures Open Interest 7-day Change | QRBitcoin Futures OI vs Price (7-Day)
What it is
This tool compares the 7-day momentum of Bitcoin perpetual futures Open Interest (OI) with the 7-day price change to classify market behavior into four intuitive regimes:
Leverage Rally (OI↑, Price↑) – positioning builds with rising price
Leveraged Sell-Off (OI↑, Price↓) – forced/short-term positioning into weakness
Deleveraging Sell-Off (OI↓, Price↓) – positions reduce while price falls
Spot Rally (OI↓, Price↑) – spot-led advance with lighter derivatives leverage
It is designed for BTC using the BINANCE:BTCUSD.P OI feed and a clean, self-contained visualization.
How it works (principle, not code)
OI Momentum: Calculates the 7-day Rate of Change (ROC) of BTC perpetual futures Open Interest.
Price Momentum: Calculates the 7-day ROC of the chart’s close.
Regime Logic: The sign of OI ROC and Price ROC determines the 4 regimes shown in the on-chart table label.
Volatility Context: A rolling standard deviation of OI ROC defines ±1σ and ±2σ bands. Bars are tinted when OI ROC exceeds ±2σ to highlight exceptional leverage shifts.
This is not a latency-sensitive microstructure model; it’s a context tool to see how derivatives positioning evolves relative to price.
Why it’s useful (originality & value)
Most OI overlays show a single line. This script adds:
a behavioral classifier (the 4 regimes) that’s immediately interpretable, and
adaptive σ-bands on OI momentum to distinguish routine leverage changes from abnormal expansions/flushes.
Together, they make it easier to read leverage cycles, spot rally quality, and identify riskier states (e.g., price up while OI surges vs. price up while OI fades).
What you see on the chart
Futures Open Interest (stepline) for BTC perpetuals (BINANCE:BTCUSD.P_OI).
OI ROC plot with zero line and ±1σ / ±2σ guides.
Bar tinting when OI ROC > +2σ (aggressive leverage build) or < −2σ (aggressive deleveraging).
Side table showing current OI ROC, Price ROC, and the regime label.
Note: If applied to a non-crypto symbol, OI will be suppressed and the script will warn that no OI data is available. It is intended for BTC.
Inputs & customization
Color mode: Choose among preset palettes to match your chart style.
(Other logic—lookbacks, σ-bands, and regime rules—are fixed to keep the reading consistent across users.)
How to use it
Confirm trends:
Leverage Rally with OI ROC above +1σ supports risk-on continuation.
Spot Rally can be constructive early in cycles, but be aware that OI can catch up quickly.
Caution in stress:
Leveraged Sell-Off often coincides with liquidation spikes and unstable conditions.
Deleveraging Sell-Off typically marks clearing phases; watch for stabilization as OI ROC returns toward 0.
Watch extremes:
±2σ moves in OI ROC are non-routine; combine with price structure, liquidations, and funding to refine decisions.
Use it as contextual confluence alongside your execution plan (levels, risk, and timeframe).
Chart-publishing guidance
Publish with a clean chart so the OI line, ROC bands, and regime label are easy to identify.
Avoid stacking unrelated indicators unless you explain why they are required to interpret the tool.
Limitations
OI feeds can vary by venue; this script uses Binance perpetual OI. Other venues may differ.
Short-term spikes (maintenance, outages, large block flows) can distort OI ROC for a few bars.
The σ-bands adapt to recent variability; regime persistence is more informative than a single spike.
Disclaimer
This script is for research and educational purposes only and is not financial advice. Trading involves risk, including loss of capital. Past performance does not predict or guarantee future results. Always validate on your timeframe and use robust risk management.
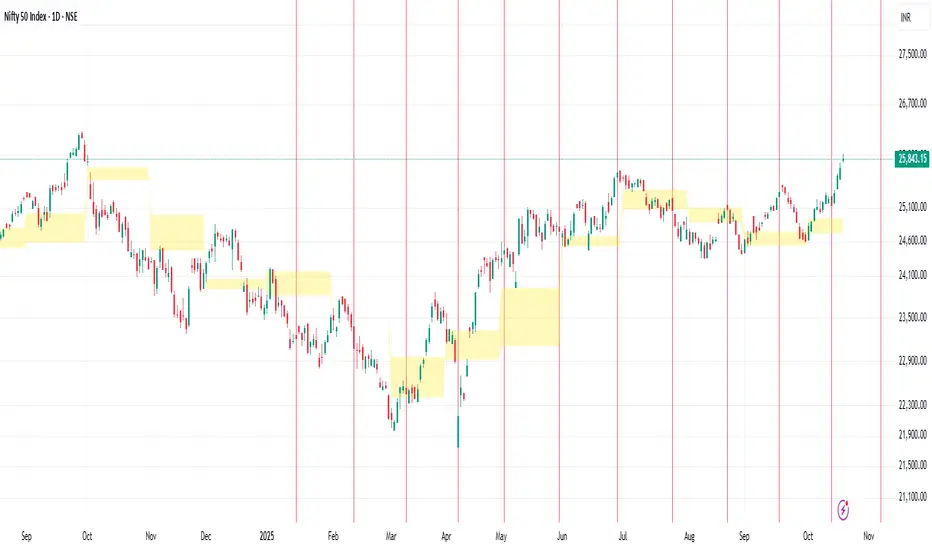
Manual Vertical Lines (ramlakshman das)This script is useful for traders who want to visually mark important past or upcoming events such as earnings announcements, market opens/closes, or economic dates directly on their price charts. Its manual input format offers maximal customization for each individual line without loops, making it straightforward to fine-tune each line’s parameters individually.
Key features include:
Manual control over up to multiple vertical lines.
Support for any date and time with precise timestamp inputs.
Customizable line colors.
Persistence of lines into the future.
Clear, user-friendly input naming for ease of use.
This indicator helps traders visually track crucial dates and prepare for events by highlighting them on their charts, improving decision-making and situational awareness during trading.
Entries + FVG SignalsE+FVG: A Masterclass in Institutional Trading Concepts
Chapter 1: The Modern Trader's Dilemma—Decoding the Institutional Footprint
In the vast, often chaotic ocean of the financial markets, retail traders navigate with the tools they are given: conventional indicators like moving averages, RSI, and MACD. While useful for gauging momentum and general trends, these tools often fall short because they were not designed to interpret the primary force that moves markets: institutional order flow. The modern trader faces a critical challenge: the tools and concepts taught in mainstream trading education are often decades behind the sophisticated, algorithm-driven strategies employed by banks, hedge funds, and large financial institutions.
This leads to a frustrating cycle of seemingly inexplicable price movements. A trader might see a perfect breakout from a classic pattern, only for it to reverse viciously, stopping them out. They might identify a strong trend, yet struggle to find a logical entry point, consistently feeling "late to the party." These experiences are not random; they are often the result of institutional market manipulation designed to engineer liquidity.
The fundamental problem that E+FVG (Entries + FVG Signals) addresses is this informational asymmetry. It is a sophisticated, institutional-grade framework designed to move a trader's perspective from a retail mindset to a professional one. It does not rely on lagging, derivative indicators. Instead, it focuses on the two core elements of price action that reveal the true intentions of "Smart Money": liquidity and imbalances.
This is not merely another indicator to add to a chart; it is a complete analytical engine designed to help you see the market through a new lens. It deconstructs price action to pinpoint two critical things:
Where institutions are likely to hunt for liquidity (running stop-loss orders).
The specific price inefficiencies (Fair Value Gaps) they are likely to target.
By focusing on these core principles, E+FVG provides a logical, rules-based solution to identifying high-probability trade setups. It is built for the discerning trader who is ready to evolve beyond conventional technical analysis and learn a methodology that is aligned with how the market truly operates at an institutional level. It is, in essence, an operating system for "Smart Money" trading.
Chapter 2: The Core Philosophy—Liquidity is the Fuel, Imbalances are the Destination
To fully grasp the power of this tool, one must first understand its foundational philosophy, which is rooted in the core tenets of institutional trading, often referred to as Smart Money Concepts (SMC). This philosophy can be distilled into two simple, powerful ideas:
1. Liquidity is the Fuel that Moves the Market:
The market does not move simply because there are more buyers than sellers, or vice-versa. It moves to seek liquidity. Large institutions cannot simply click "buy" or "sell" to enter or exit their multi-million or billion-dollar positions. Doing so would cause massive slippage and alert the entire market to their intentions. Instead, they must strategically accumulate and distribute their positions in areas where there is a high concentration of orders.
Where are these orders located? They are clustered in predictable places: above recent swing highs (buy-stop orders from shorts, and breakout buy orders) and below recent swing lows (sell-stop orders from longs, and breakout sell orders). This collective pool of orders is called liquidity. Institutions will often drive price towards these liquidity pools in a "stop hunt" or "liquidity grab" to trigger those orders, creating the necessary volume for them to fill their own large positions, often in the opposite direction of the liquidity grab itself. Understanding this concept is the key to avoiding being the "fuel" and instead learning to trade alongside the institutions.
2. Imbalances (Fair Value Gaps) are the Magnets for Price:
When institutions enter the market with overwhelming force, they create an imbalance in the order book. This energetic, one-sided price movement often leaves behind a gap in the market's pricing mechanism. On a candlestick chart, this appears as a Fair Value Gap (FVG)—a three-candle formation where the wicks of the first and third candles do not fully overlap the range of the middle candle.
These are not random gaps; they represent an inefficiency in the market's price delivery. The market, in its constant quest for equilibrium, has a natural tendency to revisit these inefficiently priced areas to "rebalance" the order book. Therefore, FVGs act as powerful magnets for price. They serve as high-probability targets for a price move and, critically, as logical points of interest where price may reverse after filling the imbalance. A fresh, unfilled FVG is one of the most significant clues an institution leaves behind.
E+FVG is built entirely on this philosophy. The "Entries Simplified" engine is designed to identify the liquidity grabs, and the "FVG Signals" engine is designed to identify the imbalances. Together, they provide a complete, synergistic framework for institutional-grade analysis.
Chapter 3: The Engine, Part I—"Entries Simplified": A Framework for Precision Entry
This is the primary trade-spotting engine of the E+FVG tool. It is a multi-layered system designed to identify a very specific, high-probability entry model based on institutional behavior. It filters out market noise by focusing solely on the sequence of a liquidity sweep followed by a clear and energetic displacement.
Feature 1: The Multi-Timeframe Liquidity Engine
The first and most crucial step in the engine's logic is to identify a valid liquidity grab. The script understands that the most significant reversals are often initiated after price has swept a key high or low from a higher timeframe. A sweep of yesterday's high holds far more weight than a sweep of the last 5-minute high.
Automatic Timeframe Adaptation: The engine intelligently analyzes your current chart's timeframe and automatically selects an appropriate higher timeframe (HTF) for its core analysis. For instance, if you are on a 15-minute chart, it might reference the 4-hour or Daily chart to identify key structural points. This is done seamlessly in the background, ensuring the analysis is always anchored to a significant structural context without requiring manual input.
The "Sweep" Condition: The script is not looking for a simple touch of a high or low. It is looking for a definitive sweep (also known as a "stop hunt" or "Judas swing"). This is defined as price pushing just beyond a key prior candle's high or low and then closing back within its range. This specific price action pattern is a classic signature of a liquidity grab, indicating that the move's purpose was to trigger stops, not to start a new, sustained trend. The "Entries Simplified" engine is constantly scanning the HTF price action for these sweep events, as they are the necessary precondition for any potential setup.
Feature 2: The Upshift/Downshift Signal—Confirming the Reversal
Once a valid HTF liquidity sweep has occurred, the engine moves to its next phase: identifying the confirmation. A sweep alone is not enough; institutions must show their hand and reveal their intention to reverse the market. This confirmation comes in the form of a powerful structural breakout (for bullish reversals) or breakdown (for bearish reversals). We call these events Upshifts and Downshifts.
Defining the Upshift & Downshift: This is the critical moment of confirmation, the market "tipping its hand."
An Upshift occurs after a liquidity sweep below a key low. Following the sweep, price reverses with energy and produces a decisive breakout to the upside, closing above a recent, valid swing high. This action confirms that the prior downtrend's momentum is broken, the downward move was a trap to engineer liquidity, and institutional buyers are now in aggressive control.
A Downshift occurs after a liquidity sweep above a key high. Following the sweep, price reverses aggressively and produces a sharp breakdown to the downside, closing below a recent, valid swing low. This confirms that the prior uptrend's momentum has failed, the upward move was a liquidity grab, and institutional sellers have now taken control of the market.
Algorithmic Identification: The E+FVG engine uses a proprietary algorithm to identify these moments. It analyzes the candle sequence immediately following a sweep, looking for a specific type of market structure break characterized by high energy and displacement—often leaving imbalances (Fair Value Gaps) in its wake. This is not a simple "pivot break"; the algorithm is designed to distinguish between a weak, indecisive wiggle and a true, institutionally-backed Upshift or Downshift.
The Signal: When this precise sequence—a HTF liquidity sweep followed by a valid Upshift or Downshift on the trading timeframe—is confirmed, the indicator plots a clear arrow on the chart. A green arrow below a low signifies a Bullish setup (confirmed by an Upshift), while a red arrow above a high signifies a Bearish setup (confirmed by a Downshift). This is the core entry signal of the "Entries Simplified" engine.
Feature 3: Automated Price Projections—A Built-In Trade Management Framework
A valid entry signal is only one part of a successful trade. A trader also needs a logical framework for taking profits. The E+FVG engine completes its trade-spotting process by providing automated, mathematically-derived price projections.
Fibonacci-Based Logic: After a valid Upshift or Downshift signal is generated, the script analyzes the price leg that created the setup (i.e., the range from the liquidity sweep to the confirmation breakout/breakdown). It then uses a methodology based on standard Fibonacci extension principles to project several potential take-profit (TP) levels.
Multiple TP Levels: The indicator projects four distinct TP levels (TP1, TP2, TP3, TP4). This provides a comprehensive trade management framework. A conservative trader might aim for TP1 or TP2, while a more aggressive trader might hold a partial position for the higher targets. These levels are plotted on the chart as clear, labeled lines, removing the guesswork from profit-taking.
Dynamic and Adaptive: These projections are not static. They are calculated uniquely for each individual setup, based on the specific volatility and range of the price action that generated the signal. This ensures that the take-profit targets are always relevant to the current market conditions.
The "Entries Simplified" engine, therefore, provides a complete, end-to-end framework: it waits for a high-probability condition (HTF sweep), confirms it with a specific entry model (Upshift/Downshift), and provides a logical road map for managing the trade (automated projections).
Chapter 4: The Engine, Part II—"FVG Signals": Mapping Market Inefficiencies
This second, complementary engine of the E+FVG tool operates as a market mapping system. Its sole purpose is to identify, plot, and monitor Fair Value Gaps (FVGs)—the critical price inefficiencies that act as magnets and potential reversal points.
Feature 1: Dual Timeframe FVG Detection
The significance of an FVG is directly related to the timeframe on which it forms. A 1-hour FVG is a more powerful magnet for price than a 1-minute FVG. The FVG engine gives you the ability to monitor both simultaneously, providing a richer, multi-dimensional view of the market's inefficiencies.
Chart TF FVGs: The indicator will, by default, identify and plot the FVGs that form on your current, active chart timeframe. These are useful for short-term scalping and for fine-tuning entries.
Higher Timeframe (HTF) FVGs: With a single click, you can enable the HTF FVG detection. This allows you to overlay, for example, 1-hour FVGs onto your 5-minute chart. This is an incredibly powerful feature. Seeing a 5-minute price rally approaching a fresh, unfilled 1-hour bearish FVG gives you a high-probability context for a potential reversal. The HTF FVGs act as major points of interest that can override the short-term price action.
Feature 2: The Intelligent "Tap-In" Logic—Beyond a Simple Touch
Many FVG indicators will simply alert you when price touches an FVG. The E+FVG engine employs a more sophisticated, two-stage logic to generate its signals, which helps to filter out weak reactions and focus on confirmed reversals.
Stage 1: The Entry. The first event is when price simply enters the FVG zone. This is a "heads-up" moment, and the indicator can be configured to provide an initial alert for this event.
Stage 2: The Confirmed "Tap-In." The official signal, however, is the "Tap-In." This is a more stringent condition. For a bullish FVG, a Tap-In is only confirmed after price has touched or entered the FVG zone and then closed back above the FVG's high. For a bearish FVG, the price must touch or enter the zone and then close back below the FVG's low. This confirmation logic ensures that the FVG has not just been touched, but has been respected and rejected by the market, making the resulting arrow signal significantly more reliable than a simple touch alert.
Feature 3: Interactive and Clean Visuals
The FVG engine is designed to provide maximum information with minimum chart clutter.
Clear, Color-Coded Boxes: Bullish FVGs are plotted in one color (e.g., green or blue), and bearish FVGs in another (e.g., red or orange), with a clear distinction between Chart TF and HTF zones.
Optional Box Display: Recognizing that some traders prefer a cleaner chart, you have the option to hide the FVG boxes entirely. Even with the boxes hidden, the underlying logic remains active, and the script will still generate the crucial Tap-In arrow signals.
Automatic Fading: Once an FVG has been successfully "tapped," the script can be set to automatically fade the color of the box. This provides a clear visual cue that the zone has been tested and may have less significance going forward.
Expiration: FVGs do not remain relevant forever. The script automatically removes old FVG boxes from the chart after a user-defined number of bars, ensuring your analysis is always focused on the most recent and relevant market inefficiencies.
Chapter 5: The Power of Synergy—How the Two Engines Work Together
While both the "Entries Simplified" engine and the "FVG Signals" engine are powerful standalone tools, their true potential is unlocked when used in combination. They are designed to provide confluence—a scenario where two or more independent analytical concepts align to produce a single, high-conviction trade idea.
Scenario A: The A+ Setup (Upshift into FVG). This is the highest probability setup. Imagine the "Entries Simplified" engine detects a HTF liquidity sweep below a key low, followed by a bullish Upshift signal. You look at your chart and see that this strong upward displacement is heading directly towards a fresh, unfilled bearish HTF FVG. This provides you with both a high-probability entry signal and a logical, high-probability target for the trade.
Scenario B: The FVG Confirmation. A trader might see the "Entries Simplified" engine generate a bearish Downshift signal. They feel it is a valid setup but want one extra layer of confirmation. They wait for price to rally a little further and "tap-in" to a nearby bearish FVG that formed during the Downshift's displacement. The FVG Tap-In signal then serves as their final confirmation trigger to enter the trade.
Scenario C: The Standalone FVG Trade. The FVG engine can also be used as a primary trading tool. A trader might notice that price is in a strong uptrend. They see price pulling back towards a fresh, bullish HTF FVG. They are not waiting for a full Upshift/Downshift setup; instead, they are simply waiting for the FVG Tap-In signal to confirm that the pullback is likely over and the trend is ready to resume.
By learning to read the interplay between these two engines, a trader can elevate their analysis from a one-dimensional process to a multi-dimensional, context-aware methodology.
Chapter 6: The Workflow—A Step-by-Step Guide to Practical Application
Step 1: The Pre-Market Analysis (Mapping the Battlefield). Before your session begins, enable the HTF FVG detection. Identify the key, unfilled HTF FVGs above and below the current price. These are your major points of interest for the day—your potential targets and reversal zones.
Step 2: Await the Primary Condition (Patience for Liquidity). During your trading session, your primary focus should be on the "Entries Simplified" engine. Your job is to wait patiently for the script to identify a valid HTF liquidity sweep. Do not force trades in the middle of a price range where no significant liquidity has been taken.
Step 3: The Upshift/Downshift Alert (The Call to Action). When the red or green arrow from the "Entries Simplified" engine appears, it is your cue to focus your attention. This is a potential high-probability setup.
Step 4: The Confluence Check (Building Conviction). With the Upshift or Downshift signal on your chart, ask the key confluence questions:
Did the displacement from the Upshift/Downshift create a new FVG?
Is the projected path of the trade heading towards a pre-identified HTF FVG?
Has an FVG Tap-In signal appeared shortly after the initial signal, offering further confirmation?
Step 5: Execute and Manage. If you have sufficient confluence, execute the trade. Use the automated price projections as your guide for profit-taking. A logical stop-loss is typically placed just beyond the high or low of the liquidity sweep that initiated the entire sequence.
Chapter 7: The Trader's Mind—Mastering the Institutional Mindset
This tool is more than a set of algorithms; it is a training system for professional trading psychology.
From Chasing to Trapping: You stop chasing breakouts and instead learn to identify where others are being trapped.
From FOMO to Patience: The strict, sequential logic of the entry model (Sweep -> Upshift/Downshift) forces you to wait for the highest quality setups, curing the Fear Of Missing Out.
Probabilistic Thinking: By focusing on liquidity and imbalances, you begin to think in terms of probabilities, not certainties. You understand that you are putting on trades where the odds are statistically in your favor, which is the cornerstone of any professional trading career.
Clarity and Confidence: The clear, rules-based signals remove ambiguity and second-guessing. This builds the confidence needed to execute trades decisively when the opportunity arises.
Chapter 8: Frequently Asked Questions & Scenarios
Q: The "Entries Simplified" code looks complex. Do I need to understand all of it?
A: No. The engine is designed to perform its complex analysis in the background. Your job is to understand the principles—liquidity sweep and the resulting Upshift or Downshift—and to recognize the clear arrow signals that the script generates when those conditions are met.
Q: Can I turn one of the engines off?
A: Yes, the indicator is modular. If you only want to focus on Fair Value Gaps, for example, you can disable the plot shapes for the "Entries Simplified" signals in the settings, and vice-versa.
Q: Does this work on all assets and timeframes?
A: The principles of liquidity and imbalance are universal and apply to all markets, from cryptocurrencies to forex to indices. The fractal nature of the analysis means the concepts are valid on all timeframes. However, it is always recommended that a trader backtest and forward-test the tool on their specific instrument and timeframe of choice to understand its unique behavior.
Author's Instructions
To request access to this script, please send me a direct private message here on TradingView.
Alternatively, you can find more information and contact details via the link on my profile signature.
Please DO NOT request access in the Comments section. Comments are for questions about the script's methodology and for sharing constructive feedback.

Wolfe Waves [BigBeluga]🔵 OVERVIEW
The Wolfe Waves pattern was first introduced by Bill Wolfe , a trader and analyst in the 1980s–1990s who specialized in market geometry and natural rhythm cycles. Wolfe observed that price often forms symmetrical wave structures that anticipate equilibrium points where supply and demand meet. These formations, called Wolfe Waves , gained popularity as a reliable pattern for forecasting both short- and long-term reversals.
The Wolfe Waves indicator automatically detects these patterns in real time. It tracks sequences of five pivots (points 1 through 5) and connects them with wave lines. Users can select either Bullish or Bearish Wolfe Waves depending on their trading bias. When the pattern fails, the lines automatically turn red to highlight invalidation.
🔵 CONCEPTS
Five-Point Structure – Wolfe Waves are defined by five pivots (1–5), which together form the basis of the wave pattern.
Bullish Pattern – Occurs when price compresses downward into point 5, signaling a potential upside reversal.
Bearish Pattern – Occurs when price extends upward into point 5, forecasting a downside reversal.
Validation & Failure – The pattern is considered valid once all five pivots form; if price fails to respect the expected breakout, the indicator marks the structure as broken with red lines.
🔵 FEATURES
Automatic detection of Bullish and Bearish Wolfe Waves.
Labels each pivot (1–5) on the chart for clarity.
Draws connecting lines between pivots to visualize the wave structure.
Projects target/dashed lines (EPA/ETA) based on Wolfe Wave geometry.
Lines automatically turn red when the pattern is broken, giving immediate feedback.
Customizable color scheme for bullish (lime) and bearish (orange) waves.
Adjustable sensitivity for pivot detection.
🔵 HOW TO USE
Choose between Bullish or Bearish mode depending on your analysis.
Watch for the formation of all five pivots; the indicator labels them clearly.
Look for potential entries near point 5, with the expectation that price will travel toward the projected EPA line.
Use invalidation (lines turning red) as a risk management warning to exit failed setups.
Combine with momentum, volume, or higher-timeframe analysis to increase reliability.
🔵 CONCLUSION
The Wolfe Waves brings the classic Wolfe Wave theory into an automated TradingView tool. Inspired by Bill Wolfe’s original concept of natural market cycles, this indicator detects, labels, and validates Wolfe Waves in real time. With automatic invalidation marking and customizable settings, it offers traders a structured way to harness one of the most well-known geometric reversal patterns.

007 GC"Golden EYE" 007 GC is used to quickly identify reversals on GC/MGC with clear entries and exits.

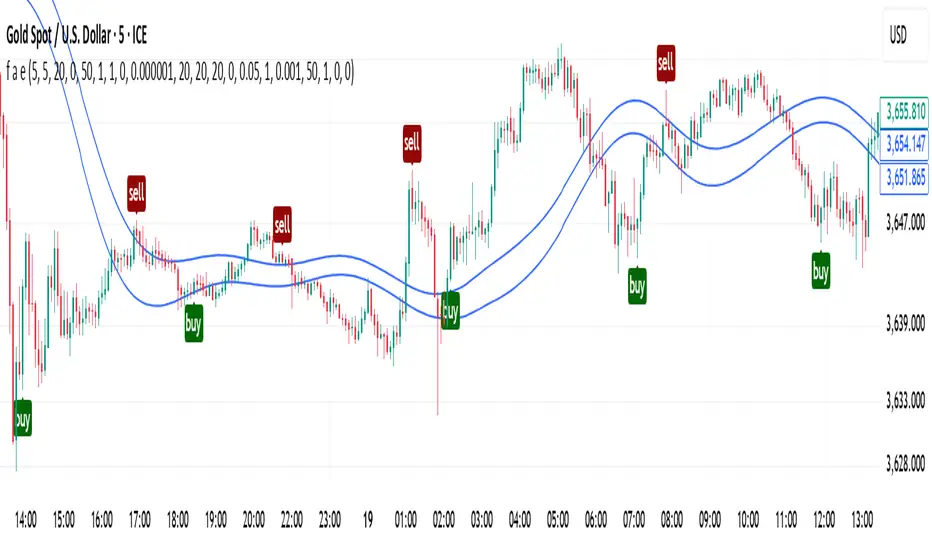
buy and sell signal f a e abarmoamelegar🔒 f a e — Trend-Sensitive Signal System
This invite-only indicator combines multiple layers of market analysis to help traders identify potential buy and sell zones with dynamic visual feedback. While the core logic remains proprietary, here’s what users can expect:
📈 Structure Recognition
The script detects recent swing highs and lows using configurable pivot logic. It then connects these points with color-coded lines that reflect the current market regime — bullish, bearish, or neutral — based on slope analysis.
🧠 Multi-Factor Confirmation
Signals are generated only when multiple conditions align. These include:
- Price interaction with adaptive volatility bands
- Trend direction inferred from recent structural shifts
- Optional filters based on candle behavior, momentum, and timing
- Risk-to-reward logic for dynamic stop-loss and take-profit levels
🎯 Signal Management
Each signal is tracked internally to evaluate its outcome. The system calculates hit rate, net performance, and trade count — helping users assess historical behavior without repainting.
⚙️ Customization
Users can fine-tune sensitivity, confirmation layers, and risk parameters to match their trading style. The system adapts to both trending and ranging environments.
This tool is designed to assist with market analysis and does not guarantee future performance. All signals are for informational purposes only and should be used alongside sound risk management.
Scalping m15 indicator RovTradingScalping Indicator Combining UT Bot and Linear Regression Candles.
UT Bot uses ATR Trailing Stop to identify entry points.
Linear Regression Candles smooth price action and provide trend signals.
The indicator is suitable for scalping trading on the M15 timeframe.

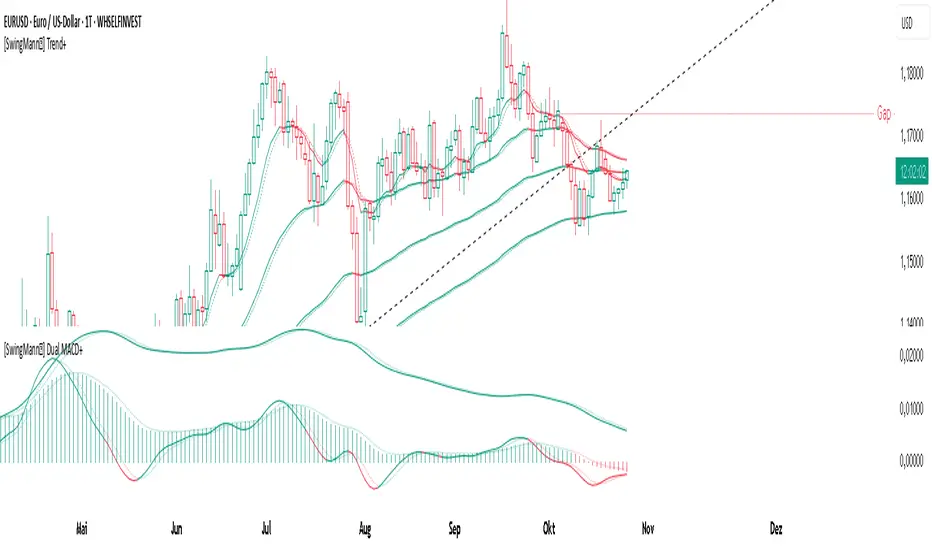
[SwingMann©] Dual MACD+ Dual MACD+
Momentum and Trend Strength Analysis on Two Levels
Description:
The Dual MACD+ combines two distinct MACD configurations to visualize both short-term and medium-term momentum shifts.
By displaying both MACDs side by side, it helps identify phases where momentum and trend direction reinforce or diverge from each other.
The first MACD 1captures short-term swings, while the second MACD 2 provides a smoother view of the broader trend.
Distinct color coding between the two layers allows quick visual recognition of trend strength and directional shifts.
Key Features:
Dual MACD structure for synchronized momentum and trend analysis
Unglättete (raw) MACD calculation — MT4 compatible
Clear color separation for Long and Short phases
Minimalist design focused on clarity and precision
Recommended Use:
Perfect for combination with price action analysis, regression channels, or higher-level swing structures (e.g. EWTrend+ or MACD+).
[SwingMann©] MACD+ MACD+
Advanced MACD with flexible smoothing and MA types
Description:
The MACD+ is an enhanced version of the classic MACD indicator, designed to give traders greater control over the calculation and smoothing process.
With selectable moving average types (SMA, EMA, WMA) and additional smoothing options for both the MACD and Signal lines, it offers a more refined way to visualize market momentum and trend shifts.
Highlights:
• Choose between SMA, EMA, and WMA for MACD and Signal Line
• Independent smoothing for both MACD and Signal values
• Clean histogram visualization
• Alerts for bullish/bearish histogram phase shifts
• Perfect companion to SwingMann© EWTrend+

[SwingMann©] EWTrend+ EWTrend+
Trend and Elliott Wave Cycle Indicator
Description:
EWTrend+ is a versatile indicator specifically designed to visualize market trends and Elliott Wave cycles. By combining multiple EMA lengths with flexible smoothing options, it enables precise trend analysis and signal generation.
Key Features:
Dynamic Trend Colors: Green for uptrends, red for downtrends, gray for neutral phases.
Multiple EMAs: Configurable lengths for different time horizons.
Flexible Smoothing: Choose SMA, EMA, WMA, RMA, DMA, or no smoothing at all.
Signal Lines: WMA-based signal lines for each EMA, optionally visible or hidden.
Offset Function:
Displays indicator lines slightly shifted for clearer visualization of market movements.
Elliott Wave Cycle Orientation:
Assists in identifying impulsive and corrective market phases.
When combined, absolutely lethal ;-)
Benefits:
Provides a clear visual overview of short- and long-term trends.
Supports the analysis of Elliott Wave patterns for strategic entries and exits.
Ideal for swing traders, day traders, and technical analysts.
Conclusion:
Multiple EMAs for various time horizons
Dynamic trend colors for quick orientation
Signal lines for trend confirmation
Offset function for improved visualization
Supports Elliott Wave cycle analysis
Note:
EWTrend+ is a tool for analysis and does not replace independent trading decisions. Please test the indicator on a demo account before live use.

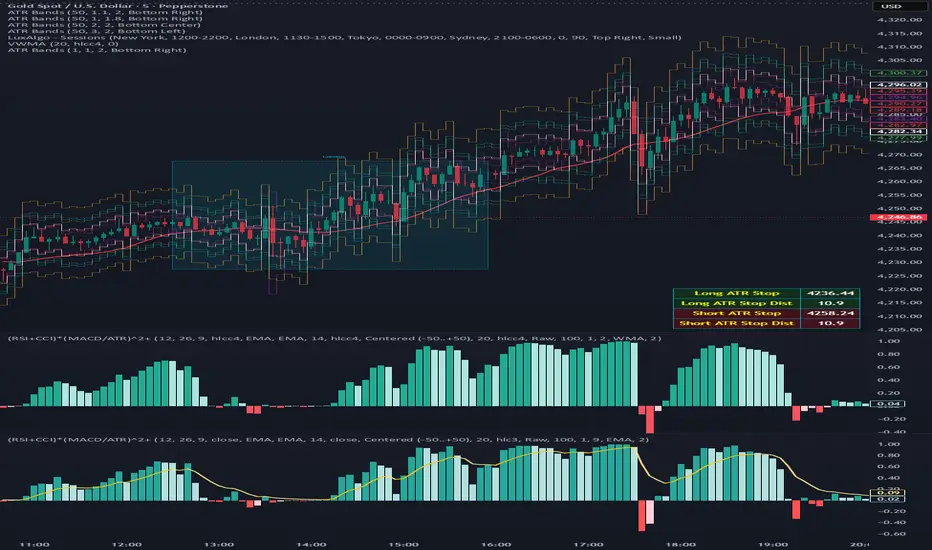
Composite Momentum System⚙️ Composite Momentum System — RSI + CCI + Momentum + MFI + (DI·ADX) × MACD² (4-Color Smoothed Signal)
This advanced indicator fuses multiple momentum, volume, and trend components into one unified oscillator, dynamically visualized around a zero line. It helps traders identify powerful directional moves, trend reversals, and momentum exhaustion far earlier than traditional MACD or RSI alone.
🧩 Core Formula
Composite = ((RSI + CCI + Momentum + MFI) + (((DI− × −1) + DI+) × ADX)) × (MACD²)
RSI – captures relative strength and short-term momentum
CCI – measures deviation from price mean (volatility & cycles)
Momentum – shows raw velocity of price change
MFI – volume-weighted momentum, adds money flow confirmation
DI / ADX – directional strength and market trend intensity
MACD² – amplifies strong momentum moves and filters weak noise
🌈 Visual Design & Features
Zero-Centered Histogram:
Green = Bullish momentum, Red = Bearish momentum
MACD Signal Line (4 Colors):
🟢 Positive & Rising → strong up momentum
🟡 Positive & Falling → weakening uptrend
🔴 Negative & Falling → strong downtrend
🟠 Negative & Rising → possible bearish fade or reversal
Adjustable Signal Smoothing:
Choose MA type (SMA, EMA, RMA, WMA, VWMA) and custom smoothing length for cleaner visualization.
ATR Normalization:
Optional setting to keep MACD and composite values consistent across instruments.
Centering Options:
RSI and MFI can be centered (−50/+50) to balance oscillation around zero.
🎯 How to Use
Above 0: Bullish composite energy → favor long setups.
Below 0: Bearish composite energy → favor short setups.
Signal line color changes highlight momentum acceleration or slowdown.
Crosses through zero often precede major shifts or breakout moments.
⚡ Best Practice
Use this indicator as a momentum strength filter in confluence with price action or volume patterns.
Combine it with VWAP, higher-timeframe trend, or support/resistance zones for high-probability entries.

(RSI + CCI) × (MACD/ATR)^2⚙️ (RSI + CCI) × (MACD / ATR)² Composite — Normalized, Compressed, Dynamic Colors
This advanced composite oscillator merges three powerful momentum indicators — RSI, CCI, and MACD — into one normalized and volatility-adjusted signal that reacts smoothly across all markets.
By dividing MACD by ATR (Average True Range), the indicator self-scales for different symbols, and an optional tanh-like compression prevents extreme spikes while keeping the movement fluid and responsive.
🧩 Core Formula
(RSI + CCI) × (MACD / ATR)²
(optionally passed through a tanh compression for stability)
RSI and CCI are normalized (RSI ÷ 50, CCI ÷ 100) → roughly −2 to +2 range.
MACD is volatility-adjusted by ATR → scale-independent between assets.
The result is centered around 0 for clear bullish/bearish momentum comparison.
🎨 Visual Features
🟢🔴 Dynamic 4-Color Histogram
Positive + Rising = Strong Teal
Positive + Falling = Light Teal
Negative + Falling = Strong Red
Negative + Rising = Light Red
🟡⚫ 4-Color Smoothing Line
Positive & Rising = Bright Yellow
Positive & Falling = Soft Yellow
Negative & Rising = Grey
Negative & Falling = Dark Grey
Zero-centered layout for intuitive bullish/bearish visualization.
⚙️ Adjustable Parameters
Individual RSI, CCI, and MACD lengths and sources.
ATR length for volatility normalization.
Optional tanh-style compression with adjustable gain (to keep values in ±1 range).
Fully customizable colors and line widths for both bars and smoothing line.
🔔 Alerts
Triggered automatically when the composite crosses above or below zero, signaling potential trend reversals or momentum shifts.
💡 How to Use
Composite > 0 → Bullish momentum ↑
Composite < 0 → Bearish momentum ↓
A brightening line or bar = momentum accelerating.
A fading color = momentum weakening or reversal forming.
Combine with higher-timeframe trend filters (EMA, VWAP, Supertrend) for confirmation.
Continuation Gauge - ES 3m (v1.1)Continuation Gauge - ES 3m (v1.1)
wave trend analysis between bull and bear imbalance trends

CMF, RSI, CCI, MACD, OBV, Fisher, Stoch RSI, ADX (+DI/-DI)Eight normalized indicators are used in conjunction with the CMF, CCI, MACD, and Stoch RSI indicators. You can track buy and sell decisions by tracking swings. The zero line is for reversal tracking at -20, +20, +50, and +80. You can use any of the nine indicators individually or in combination.

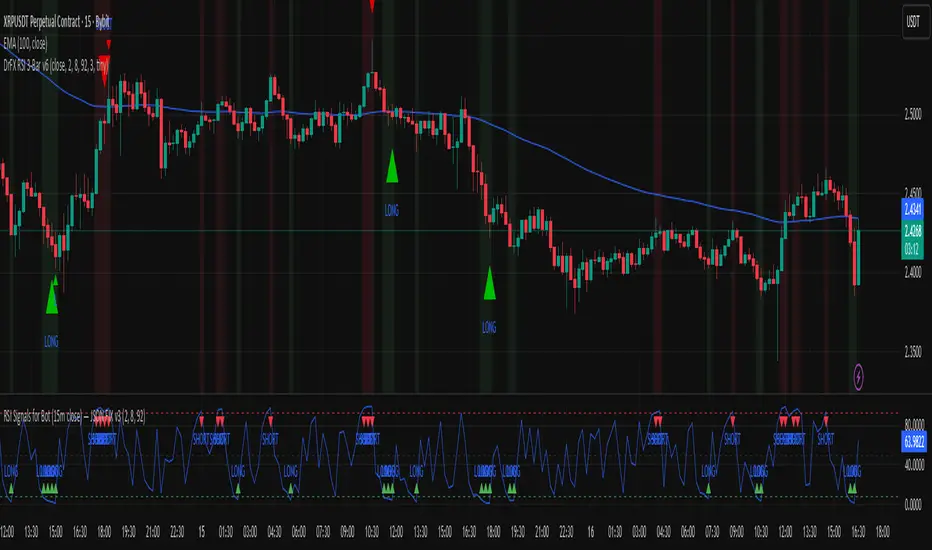
RSI Signals for Bot (15m close) — JSON FIX v4RSI Signals for Bot (JSON Ready) is a lightweight automation-friendly indicator that generates clean LONG and SHORT alerts based on RSI thresholds, fully formatted in JSON for webhook-based trading bots.
It’s designed primarily for 15-minute charts and sends one alert per confirmed bar close.
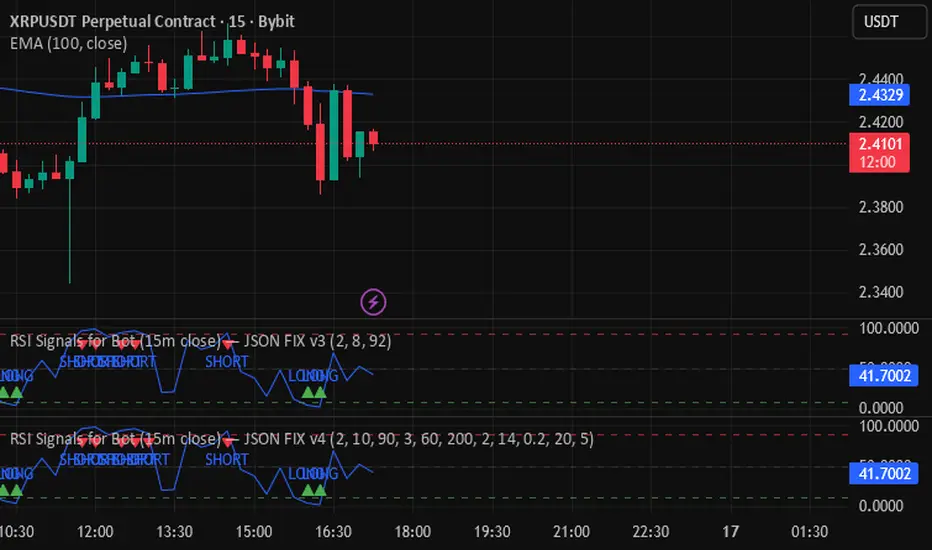
Rsi- bybitbot - JSON v3Backtesting based on the RSI indicator, based on the RSI length, RSI level, and the number of candles at the RSI level. Backtesting for monitoring in-points.
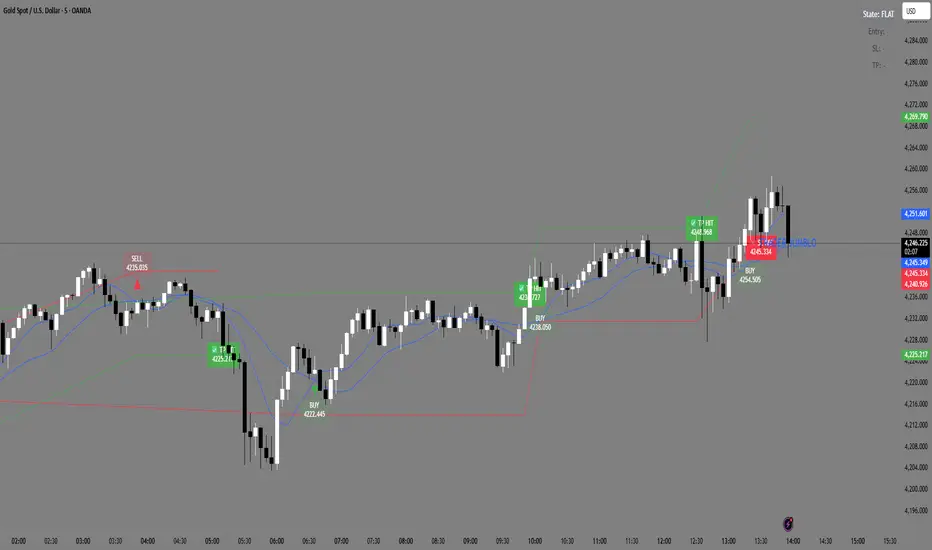
Trader Jumblo Auto Signal V6Trader Jumblo Auto Signal V6 is an advanced crossover-based signal system designed to generate persistent BUY and SELL entries with dynamic ATR-based Take Profit (TP) and Stop Loss (SL) levels.It provides clean, non-repainting trade signals that remain visible on the chart even after price movement — ensuring clarity during both backtesting and live trading sessions.
⚙️ How It Works
🟦 Two Blue Lines — These are your moving averages (Fast and Slow).
The crossover between them determines the signal direction.
When the Fast MA (light blue) crosses above the Slow MA → a BUY signal appears.
When the Fast MA crosses below the Slow MA → a SELL signal appears.
You can choose between SMA or EMA and adjust the lengths in the settings.
🟢 Green Line — The Take Profit (TP) level, calculated using ATR × TP multiplier.
It shows the projected target area for profit when a trade is active.
🔴 Red Line — The Stop Loss (SL) level, also based on ATR × SL multiplier.
It marks the risk boundary for each signal.
✅ When price reaches the green line, “TP HIT” appears.
❌ When price hits the red line, “SL HIT” appears.
These markers persist so you can analyze trade outcomes clearly.
📈 Main Features
Dynamic ATR-based TP and SL levels (auto-adjust with volatility)
Persistent entry, TP, and SL labels (no vanishing signals)
Optional RSI filter for signal confirmation
Instant alert system for BUY/SELL/TP/SL or combined events
Lightweight and optimized for any timeframe
⚡ Best Use
Ideal for swing and intraday traders who want visual clarity and structured risk/reward zones. Works effectively on Gold, Forex, crypto, indices, and stocks
Adaptive Regime Hybrid (Trend + MeanRev)Adaptive Regime Hybrid — see whether the market wants a trend or a reversion. One oscillator, clearer trades.
Try ARH on your favorite instrument and timeframe. Start with default settings; increase SigThreshold for fewer high‑conviction signals, or raise SmoothW to reduce whipsaw in choppy markets.
