Fixed High Timeframe Moving AveragesFixed High Timeframe Moving Averages (W/D/4H)
Summary
This indicator plots essential, high-timeframe (HTF) Moving Averages onto your chart, **no matter which timeframe you are currently viewing**.
It is designed for traders who need multi-timeframe context at a glance. Stop switching charts to see where the 200-Week or 50-Day MA is—now you can see all critical HTF levels directly on your 5-minute (or any other) chart.
---
Who it’s for
Traders who rely on moving averages but like to work on lower chart timeframes while keeping higher timeframe context in sight. If you scalp on 1–15m yet want Weekly/Daily/4H MAs always visible, this is for you.
---
What it shows
Pinned (“fixed”) moving averages from higher timeframes—Weekly (20/100/200) , Daily (50/100/200/365) and 4H (200) —rendered on any chart timeframe. Your favorite HTF MAs stay on screen no matter what TF you’re currently analyzing.
---
Features
* **MA types:** SMA, EMA, VWMA, Hull.
* **Fully configurable:** toggle each line, set periods, colors, and thickness.
* **Two alert modes (see below):** intrabar vs confirmed HTF close.
* **Works on any symbol & chart TF** using `request.security` to fetch HTF data.
---
Alerts & Modes
This indicator solves the biggest problem with MTF alerts: false signals. You can choose one of two modes:
1. **Intrabar mode** — compares current chart price to the HTF MA. Triggers as soon as price crosses the HTF line; great for early signals but may update until the HTF bar closes.
2. **Confirmed mode** — checks HTF close vs HTF MA. Signals only on the higher-TF bar close; fewer false starts, no intrabar repainting on that TF.
Per-line *Cross Above / Cross Below* conditions are provided for all enabled MAs (e.g., “20W — Cross Above”, “365D — Cross Below”, etc.).
**How to use alerts:** add the script → “Create Alert” → pick any condition from the script’s list.
---
Why this helps
* Keeps Weekly/Daily structure visible while you execute on LTF.
* Classic anchors (e.g., 200D, 20W/100W/200W) are popular for trend bias, dynamic support/resistance, and pullback context.
* Lets you standardize MA references across all your lower-TF playbooks.
---
Notes on confirmation & repainting
* Intrabar signals can change until the higher-TF bar closes (that’s expected with multi-TF data).
* Confirmed mode waits for the HTF close—cleaner, but later. Choose what fits your workflow.
---
Quick setup
1. Pick `MA Type` (SMA/EMA/VWMA/Hull).
2. Enable the HTF lines you want (Weekly 20/100/200; Daily 50/100/200/365; 4H 200).
3. Choose `Alert Mode` (Intrabar vs Confirmed).
4. Style colors/widths to taste and set alerts on the lines you care about.
---
Good practice
* Combine HTF MAs with price action (swings, structure, liquidity grabs) rather than using them in isolation.
* Always validate signals in your execution TF and use a risk plan tailored to volatility.
* Protect your capital: position sizing, stops, and disciplined risk management matter more than any single line on the chart.
---
Disclaimer
For educational/informational purposes only; not financial advice. Trading involves risk—manage it responsibly.
Vwmas

Moving Averages SuiteThe Moving Averages Suite is a powerful technical analysis tool that provides traders with unparalleled control over five different moving averages and two special moving average indexes. This suite is designed to provide traders with a comprehensive understanding of market trends and help them make more informed trading decisions.
By default, the Moving Averages Suite displays two special moving average indexes that are made from the moving averages within the suite. These special moving average indexes are specially weighted indexes that are designed to provide a more accurate representation of market trends. The first index is the Moving Average Directional Index (MADI), which measures the strength of the trend in the market. The second index is the Moving Average Oscillator Index (MAOI), which measures the momentum of the trend in the market.
In addition to these special indexes, traders can enable five different moving averages within the suite. These moving averages include the TEMA, HMA, EMA, VWMA, and SMA. Each moving average has a specific purpose and is used to provide traders with a unique perspective on market trends.
The Triple Exponential Moving Average (TEMA) is designed to reduce the lag time associated with traditional moving averages. This moving average places more weight on recent price data, providing traders with a more accurate representation of current market trends.
The Hull Moving Average (HMA) is another moving average that is designed to reduce lag time. This moving average uses weighted averages to provide traders with a more accurate representation of market trends.
The Exponential Moving Average (EMA) is a popular moving average that is used to identify trends in the market. This moving average places more weight on recent price data, providing traders with a more accurate representation of current market trends.
The Volume Weighted Moving Average (VWMA) is another moving average that is used to identify trends in the market. This moving average places more weight on periods of high volume, providing traders with a more accurate representation of market trends during high volume periods.
The Simple Moving Average (SMA) is a widely used moving average that provides traders with a simple and easy-to-understand representation of market trends.
The Moving Averages Suite is a powerful technical analysis tool that provides traders with unparalleled control over five different moving averages and two special moving average indexes. Each moving average within the suite is designed to provide traders with a unique perspective on market trends, allowing them to make more informed trading decisions. Traders who are looking to gain a comprehensive understanding of market trends should consider using the Moving Averages Suite in their trading strategies.

VWMA Volatility OscillatorVWMA Volatility Oscillator
This oscillator uses Volume Weighted Moving Averages to plot the volume. When the average is on the bottom then there is a chance that volatility contractions could be happening and a expansion could happen soon. When the average can be seen "high" like peaking then this could mean that there already is a lot of volume and the expansion is already happening.
What are contractions and expansions?
Contractions are periods in the markets where the price range gets tighter signifying decreasing volatility.
After contractions, Expansions will occur which is a strong movement upwards or downwards and the range increases, which shows an increase in volatility.
How to use this indicator
The indicator has 3 VWMA lines. The indicator also has a bottom range by getting the lowest points of each of the VWMA lines. If the VWMA lines are at the bottom ranges this can signify low volatility and a contraction. This can mean that at any moment a expansion will happen and a possible pump or dump.

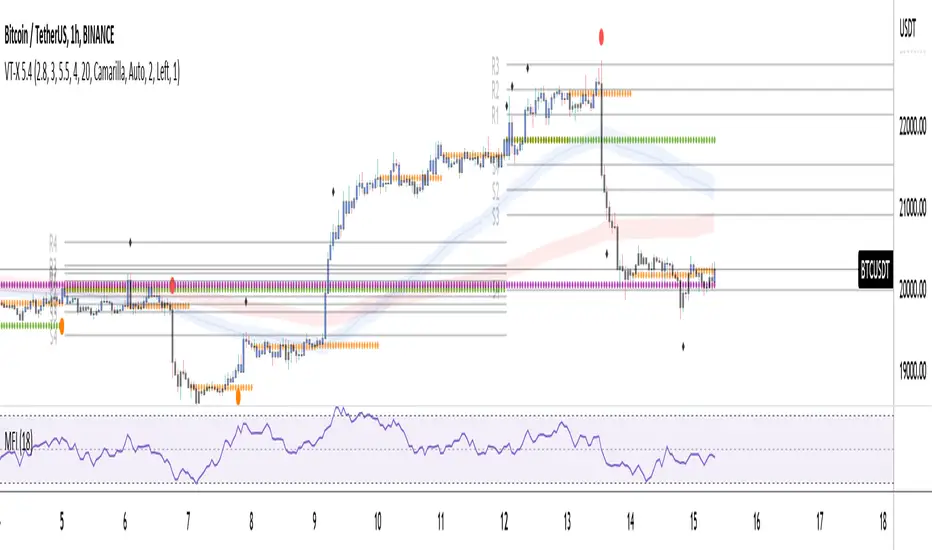
Volume and Trend reversal scalping scriptThe Vtrend X script allows for both trend based and scalping trading entries, it gives you all the trend and reversal information at hand that is necessary. It works best in a trending market.
The fundamental part of the script, is the volume weighted bands in blue and red, which help determine the trend and dynamic support and resistance . The blue band is a shorter length than the red band.
When the blue band dips below the red band, this tells us there is a downtrend. And when the blue band is trending above the red band, this is bullish uptrend price action. You will be able to note price whatever the timeframe really respects these bands, and you can use that to your advantage flicking through the high and low timeframes on where price will go next, combined with your own support and resistance levels.
Combined with the candle colors, which change whether they close above or below the main trend colored line (shown below), help identify a change in price action and trend. This allows for low timeframe plays also.
The uptrend and downtrend cicle signals are shown in a few different colors. Green and red are with the trend and have met all conditions. Orange and purple are against the trend calculations, and Olive circles risky trades against all the filters used to calculate signals.
The reversal signals, are the diamond plots in black, These also represent take profit areas as well.
Another key feature is the Daily / Weekly / Monthly and Yearly open levels displayed as colored dots. A lot of the plays i take use the Daily opens as key levels to take a trade off.
The indicator is designed to give you key information, but be quite customisable as well to suit your exact trading style.
Recommended timeframes i use for this script; Weekly (for key liquidity areas), Trading on the Daily, 6h, 4h, 2h, 1h and 25 minutes.
Backtested Settings and Pairs;
Pair - Timeframe - Signals Inputs - Reversal Inputs - ATR Multiplier - MA Filter
BTCUSD - 1 hr - 3 - 2.8 - 5.5 - NA
ETHUSD - 1 hr - 4 - 2.8 - 5.5 - NA
USDCAD - 1 hr - 4 - 2.8 - 5.5 - NA
GBPUSD - 1 hr - 4 - 2.8 - 5.5 - NA
US30 - 1 hr - 4 - 2.8 - 5.5 - NA
BTCUSD - 4 hr - 2.5 - 2.5 - 3.5 - NA
BTCUSD - 25 mins - 5 - 2.5 - 5.5 - NA
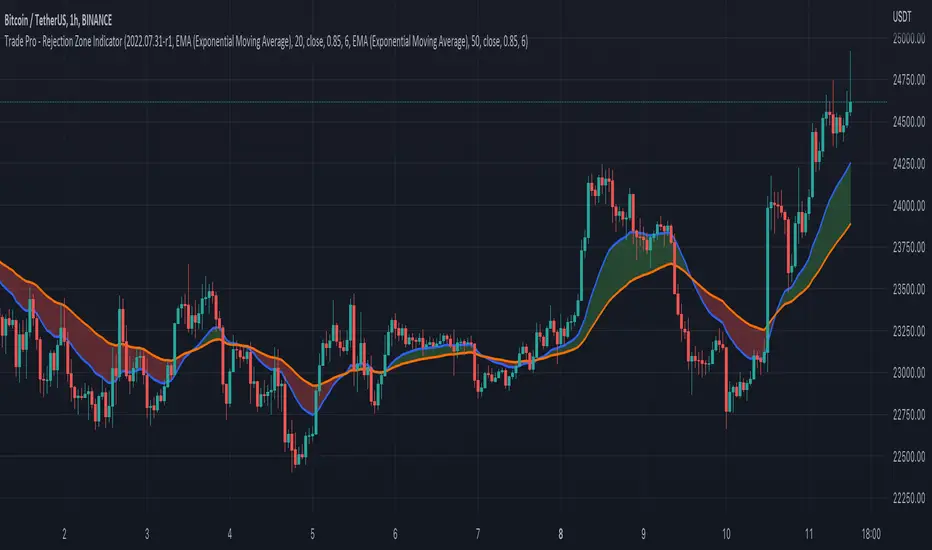
Trade Pro - Rejection Zone IndicatorThe Rejection Zone Indicator can be used to help trend following traders know when to buy dips in up trends, and when to sell pull backs in down trends.
The Rejection Zone Indicator is made up of the 20 and 50 period Exponential Moving Averages. This indicator has colored shading in between these two EMAs, which acts as a nice visual. When the 20 period Exponential Moving Average is below the 50 period Exponential Moving Average, the shaded cloud will be red, and when the 20 EMA is over the 50 EMA the cloud will be green. It is called the Rejection Zone indicator, because often in trends when price pulls back to the colored cloud, it will act as an area of support or resistance.
The suggested use of the Rejection Zone Indicator is to look for long trades when the cloud is green, and once price has pulled back into the green cloud. If the cloud is red one can look for short trading opportunity when price pulls back into the red cloud.
pickle financialversion 1.0
A multi-use indicator
FEATURES:
1) Robust VWAP with up to 3 deviations that can be adjusted for Session, Week, Month, Quarter, Year, Decade, Century, Earnings , Dividend, & Split intervals
2) 20 customizable Moving Averages that can be changed to EMAs, SMAs , WMAs, SMMAs, and VWMAs; can also be adjusted to Candle Closes, Highs, Lows, Opens, HLC3, HL2 , OHLC4, & HLCC4
-Praise be lady VWAP

Order Block and Daily Levels VTRENDThe Order Block and Daily Levels is my first script designed to add context with order blocks to how i trade.
I have included a volume weighted band in green, as it's use is core to my trading style. I have often found however, there needs to be more clarify in structure which some of my previous scripts did not provide, so i have coded up some custom order blocks, which can be altered along the lines of how sensitive they are.
There is also a high time frame volume average line to combine the green volume weighted band to identify a bullish or bearish trend.
The other key change I am experimenting with, is trading off the daily levels, this is reflected here with a change is barcolor, above or below the daily level and a 'cross' symbol.
Included are 'chance of reversal' diamonds.
You can see here with the trend, volume and structure information given, there is a clearer idea of where price might head to next. Combine this with yur own levels too.
This can be useful on low time frames too.
So far I have experimented with this script on the 4/2/1 hour and 25 / 5 minutes

Trend and Key Levels combined with Barcolor VTRENDThe Trend and Key Levels combined with Barcolor is designed to be used more on higher timeframes, 1 hour and above to show long term trend by volume weighted moving average. And allowing you to play entries off key levels. This script will not be useful on the daily or weekly timeframes if you are using the key levels.
This script changes barcolor eitherside of the volume weighted moving average to show bull or bear trend. You can see the price action at this timeframe of 1 hour, respects the volume weighted moving average as support and resistance.
The key levels to play off are the daily levels in orange, a close above results in a candle color of purple, a close below the daily open results in a candle color of maroon.
Included as levels, are the weekly, monthly and yearly.
Included are alerts for the candle color change for the daily alerts and change of trend green to red.
I hope you find this script useful!

Trend Channel [Gu5]SMA 200 determines the trend
Bullish trend, green candles. Down trend, red candles.
If the market value is narrow to the SMA200 channel, yellow candles.
Setting recommended for SMA Range
BTCUSD = 100
EURUSD = 1000
SPX = 100
ETHUSD = 10
