Project Pegasus SpectraProject Pegasus Spectra — Volume-Weighted Core is a dedicated pane-based indicator designed to visualize volume-derived buy/sell pressure, momentum states, and extreme flow events in a clean, professional layout. It translates standard OHLCV data into an orderflow-inspired structure using Pressure Candles, PA-FL Momentum (δ/ATR), an optional momentum heatmap, and optional context markers (Imbalance, Climax, Exhaustion).
The goal is not to generate trade signals, but to provide a stable, low-noise visual framework for understanding pressure, momentum, and intensity across different markets and volatility regimes.
Core Components
1) Pressure Candles (Synthetic Buy / Sell Pressure)
Spectra estimates buy and sell volume within each candle using a price-weighted volume distribution:
Buy volume ≈ volume × (close − low) / (high − low)
Sell volume ≈ volume × (high − close) / (high − low)
From this, synthetic pressure candles are constructed to highlight:
buy vs sell dominance within each bar
gradual pressure shifts
sudden pressure expansions or extremes
Pressure Style
Net – single candle showing net pressure (buy − sell)
Split Buy/Sell – buy pressure above zero, sell pressure below zero (clear dominance view)
Pressure Mode
Raw – fully reactive, unsmoothed pressure
Smooth body + raw wick – candle body is EMA-smoothed, while wicks preserve raw extremes
→ cleaner visuals without hiding pressure spikes
Visual Control
Multiple color presets (Match Palette, Neon, Ocean, Sunset, Classic, Midnight)
Optional fully custom colors
Independent body and wick transparency, allowing pressure to act as a subtle context layer rather than visual noise
2) PA-FL (Price-Adaptive Flow Line) Momentum — δ / ATR
PA-FL is the main flow engine of Spectra.
It computes a volume-adaptive baseline (EMA-style), optionally blended with VWAP, and measures momentum as baseline delta normalized by ATR.
Why δ / ATR?
Makes momentum comparable across:
different symbols
varying volatility regimes
different sessions and market conditions
PA-FL Features
Optional VWAP blend for session anchoring
Adaptive baseline length driven by relative volume
Optional Zero-Lag smoothing (ZLEMA) to reduce delay
Optional clamping to prevent rare spikes from dominating the scale
Visualization
Histogram + Line
Color intensity scales with |δ|
Optional regime tinting (trend vs range) for contextual awareness rather than hard signals
3) Momentum Heat Background (PA-FL Heatmap)
An optional background heatmap driven by |δ / ATR|.
Purpose:
Quickly visualize momentum intensity without reading exact values
Act as a situational backdrop, not a signal layer
Interpretation
Low heat → neutral / balanced phase
Rising heat → momentum expansion
Strong heat → impulse or extreme activity
Fully adjustable via:
minimum / maximum transparency
intensity scaling
gamma contrast
This allows anything from barely visible to clearly readable, depending on preference.
4) Display Normalization (Stable Axis)
When enabled, Pressure and Rolling Delta are normalized into a stable ±100-style range using percentile-based amplitude estimation plus a hard clamp.
Benefits:
consistent pane scaling across sessions and symbols
prevents single outlier bars from stretching the display
cleaner, professional multi-symbol workflows
Normalization affects display only, not internal calculations.
5) Rolling Delta (Optional Context)
An optional, subtle rolling delta line that shows cumulative pressure drift over a defined window.
The visibility scale affects display only and does not alter the underlying delta calculation.
Optional Context Markers (Sparse by Design)
Imbalance Dot
Marks bars where absolute delta exceeds a threshold:
automatic (average |Δ| × factor)
or manual (fixed value)
Use as a context alert, not a standalone entry trigger.
Climax Detector
Flags unusually large buy or sell volume relative to its average.
Typical use cases:
stop-run / liquidation-like activity
momentum kick-offs or exhaustion points
Exhaustion Filter
Combines:
high total volume relative to average
unusually small net delta
Often associated with absorption-like or exhaustion behavior, depending on market context.
Suggested Workflows
Clean Pro Layout
Pressure Candles ON with high transparency
PA-FL Histogram + Line ON
Heatmap ON (subtle)
Normalization ON
More Orderflow-Like Feel
Pressure Style: Split Buy/Sell
Smooth body + raw wick
Optional Climax markers
More Event-Focused Context
Enable Imbalance and Climax sparingly
Use Exhaustion only when specifically analyzing absorption behavior
Important Notes & Disclaimer
Spectra is based on OHLCV-derived volume estimation.
It is not true bid/ask delta, not footprint data, and not time & sales.
All markers and visual elements are informational, not trade signals.
Interpretation depends on symbol, timeframe, session, and data feed.
Always combine with market structure, levels, and risk management.
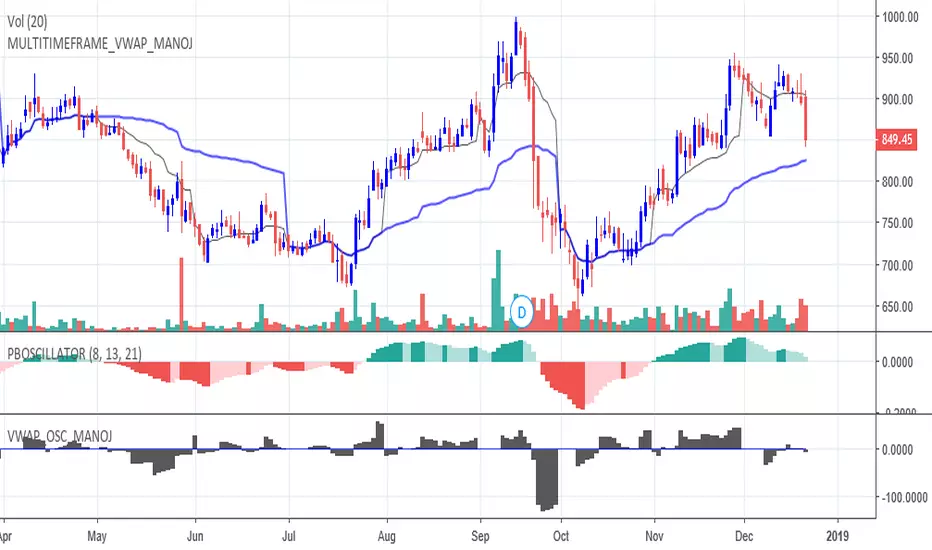
Vwaposcillator

VWAP Divergence | dobofulopOverview :
This script identifies potential bullish and bearish divergence signals using the Volume Weighted Average Price (VWAP). It calculates VWAP resets based on a selected “Anchor Period” (Session, Week, Month, Quarter, Year, Decade, Century, or corporate events like Earnings, Dividends, Splits). When price action and VWAP move in opposite directions with a sufficiently large ATR-based move over a chosen lookback period, the script plots divergence dots on the chart.
Key Features:
VWAP Anchoring : Choose an anchor period for resetting VWAP. This could be daily, weekly, monthly, or based on specific corporate events (Earnings, Dividends, Splits).
Divergence Detection : Looks for instances where the price is moving up while VWAP moves down (potential bullish divergence), and vice versa for bearish divergence.
ATR Filter : Uses the ATR (Average True Range) to filter out minor or insignificant price moves, helping to reduce noise.
Gap Check : Automatically invalidates signals if large price gaps occur within the lookback range.
Visual Signals : Bullish divergences are plotted below the bar, while bearish divergences are plotted above, making it easy to spot potential reversal zones.
How to Us
Inputs:
- Anchor Period (Session, Week, Month, etc.) – determines when the VWAP calculation restarts.
- Source (Default: HLC3) – Price source for the VWAP.
- ATR Multiplier and Lookback Period – Fine-tune the threshold for detecting significant moves vs. VWAP.
Interpretation:
- Bullish Divergence Dot: Suggests potential price strength when price moves higher but VWAP moves lower.
- Bearish Divergence Dot: Suggests potential price weakness when price moves lower but VWAP moves higher.
Disclaimer:
This script is provided for educational purposes only and should not be interpreted as financial advice. Past performance does not guarantee future results. Always conduct your own analysis and consider consulting a financial professional before making trading decisions.

VWAP with CharacterizationThis indicator is a visual representation of the VWAP (Volume Weighted Average Price), it calculates the weighted average price based on trading volume. Essentially, it provides a measure of the average price at which an asset has traded during a given period, but with a particular focus on trading volume. In our case, the indicator calculates the VWAP for the current trading symbol, using a predefined simple moving average (SMA) with a period of 14. This volume-weighted moving average offers a clearer view of the behavior of the VWAP and, of consequence of market dynamics.
One of the distinctive features of this indicator is its ability to provide a more "linear" representation of the data. This means that the data is "smoothed" to remove noise, allowing you to more easily identify the direction of the market trend. This smoother representation is especially useful because the financial market can be subject to significant fluctuations and volatility, and this indicator can help get a more stable view of the trend.
The indicator also offers a visualization of the market trend in a very intuitive way. Using an evaluation of the highs and lows of the last 10 days, determine whether the market is in an uptrend, downtrend, or no trend at all. To make this evaluation even clearer and more immediate, the indicator line is colored dynamically. When the trend is bullish, the line is blue, while in case of a bearish trend, it takes on a distinctive color, such as pink. If the trend is not defined, the line will be colored differently, for example light yellow. This coloration gives traders an immediate visual indication of the prevailing trend, allowing them to make more informed decisions regarding trading operations.
One potential strategy involves watching candles when they cross the VWAP line strongly. If, for example, a candlestick breaks above the VWAP line, we may look for retest areas near key support levels to gauge a potential long entry. In other words, we would consider that the price may have the potential to rise further after breaking above the VWAP line, and we would look to enter a long position to take advantage of this opportunity.
On the other hand, if a candlestick crosses below the VWAP line, we might consider looking for retest areas near the VWAP line itself, which now serves as potential resistance. This could indicate a possible short entry opportunity, as the price may struggle to break above the resistance represented by the VWAP line after breaking it down. In this case, we would look to take advantage of the expected continuation of the downtrend.
In both cases, the idea is to exploit significant movements across the VWAP line as signals of potential reversal or continuation of the trend. This strategy can help identify key entry points based on price behavior relative to the VWAP line.

VWOP: Volume Weighted & Oscillated PriceWhile playing around with the standard "ta.vwap" I wondered why there was no length input, so I did some research on what the underlying calculation actually is, and did my best to augment it so as to allow for a variable length based on an oscillator value.
Normal VWAP = (Number of Shares Bought x Typical Price) / Total Volume
In my VWOP Calculation, typical price is replaced by selected moving average type or "matype" and then multiplied by the volume.
Then a total value is calculated using math.sum with a length value that changes according to a selected oscillator's value. The total is then divided by
the sum of just volume using the same oscillating length value. Result is then passed through the selected"matype" once more to give the final result.
Indicator designed for use as a entry/exit indicator in conjunction with more traditional moving averages and/or signal filters. Useful for taking volume + an oscillator into account along with price, instead of just the price as with a simple moving average.

UV IndicatorUV Indicator (Ultimate VWAP Indicator) is using Volume Weighted Average Price to find Direction of the Trend, and Resistance & Support.
- Circle and Square shapes represent the point of Resistance and Support.
- Teal and Maroon background colors represent Uptrend and Downtrend of the Market.
- Numbers represent the Spread Percentages.

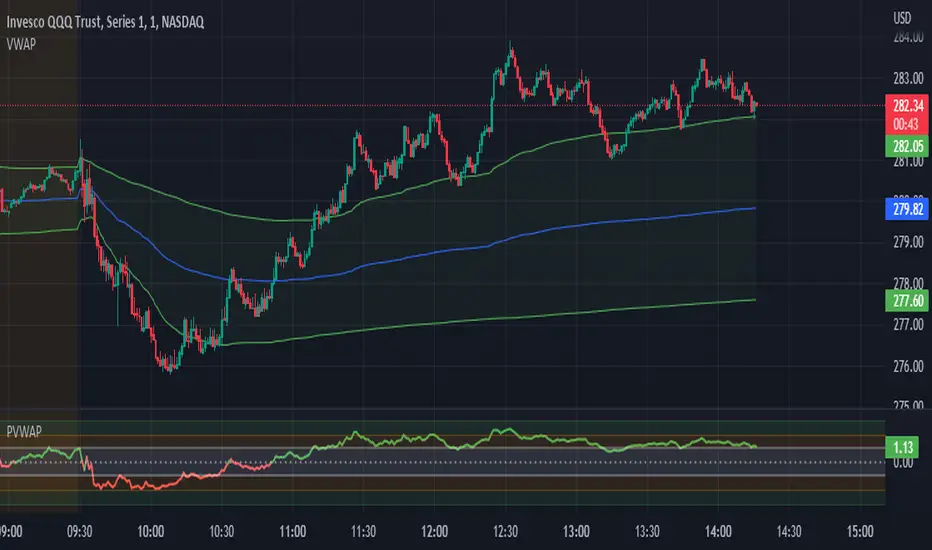
Candle Level of VWAP [By MUQWISHI]The " Price of Volume Weighted Average Price " (PVWAP) indicator calculates the VWAP standard deviation of bar price.
Features:
1. Ability to smooth the "Price of Volume Weighted Average Price" line.
2. Ability to choose the anchor period (timeframes).
Let me know if you have any questions.
Thanks.
Bogdan Ciocoiu - Sniper EntryWhat is Sniper Entry
Sniper Entry is a set indicator that encapsulates a collection of pre-configured scripts using specific variables that enable users to extract signals by interpreting market behaviour quickly, suitable for 1-3min scalping. This instrument is a tool that acts as a confluence for traders to make decisions concerning current market conditions. This indicator does not apply solely to an asset.
What Sniper Entry is not
Sniper Entry is not interpreting fundamental analysis and will also not be providing out of box market signals. Instead, it will provide a collection of integrated and significantly improved open-source subscripts designed to help traders speculate on market trends. Traders must apply their strategies and configure Sniper Entry accordingly to maximise the script's output.
Originality and usefulness
The collection of subscripts encapsulated in this tool makes it unique in the Trading View ecosystem. This indicator enables traders to consider entry positions or exit positions by comparing similar algorithms at once.
Its usefulness also emerges from the unique configurations embedded in the indicator's settings, which are different from those of the original scripts.
This indicator's originality is also reflected in how its modules are integrated, including the integration of the settings.
Open-source reuse
I used the following open-source resources, which I simplified significantly and pre-configured for short term scalping. The source codes for the below are already in the public domain, including the following links listed below.
www.tradingview.com (open source)
(open source and generic algorithm)
www.tradingview.com (open source)
(open source)
(open source)
www.tradingview.com (generic MA algorithm and open source)
(generic VWAP algorithm and open source)

VWAP Momentum OscillatorShows momentum of the difference between source price and a periodic vwap, instead of a traditional vwap, which resets at the session start/end.
I find it very handy when scalping on lower timeframes. Should not be used alone.

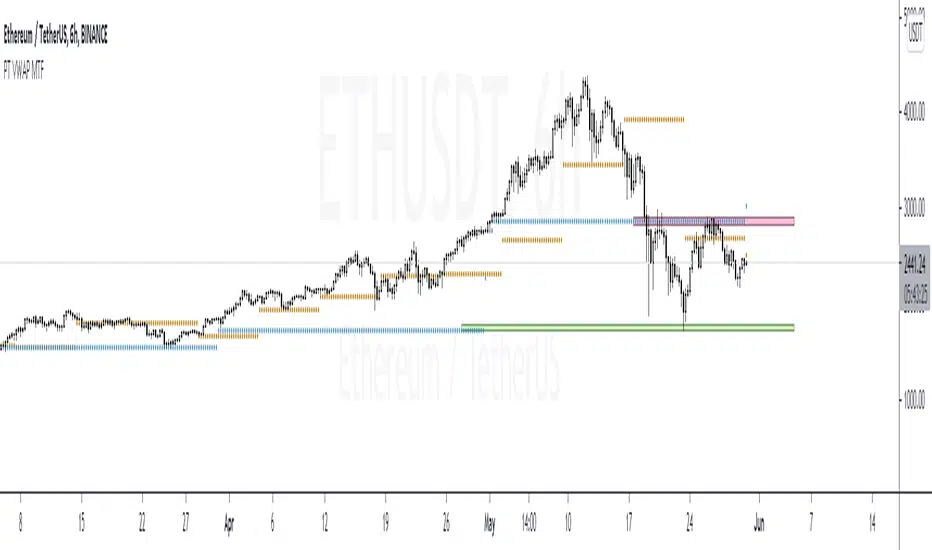
PT VWAP MTFVersion 1.0 -
A Multi Timeframe - Daily, Weekly, Monthly VWAP. Also added a feature for previous day, Daily, Weekly, Monthly VWAP .
The main strategy to this indicator is the previous day vwaps. So we put in additional logic that allows us to visually see previous day, previous week and previous monthly vwap. This helps us get a gage of bullish vs bearish trends. For instance, if price is trading above both daily and previous daily vwaps, that signifies micro trend is bullish. If price is above daily vwap but below previous daily vwap, you can use the previous day vwap as a target for you long.
If you are interested in using our version of the MTF vwap, shoot us a message!
RSI on VWAP Upgraded strategyFirst of all, the idea of apply RSI to VWAP was inspired by XaviZ; at least, that where I first saw that.
I simply applied the idea and searched for apply this on lower timeframe (M15) to increase the number of positions and improve the profit factor.
The conditions to enter are the same :
long : enter on RSI crossover oversold level
short : enter on RSI crossunder oversell level
To close position, I found a little change to apply :
long : close position when RSI(VWAP) went in overbought zone and crossunder the overbought level OR after being at least x bars in the overbought zone (parameter is 28 by default) => when the first condition happens
short : close position when RSI(VWAP) went in oversold zone and crossover the oversold level OR after being at least x bars in the oversell zone (parameter is 28 by default) => when the first condition happens
With this change, I got better results specially on BTCUSDTPERP (M15) where I reach a 6.8 profit factor with 119 trades closed. Not BAD !
The defaults parameters are the best found for BTCUSDTPERP (M15), but the strategy works fine for other pairs if you take time to find the rights combinations.
In this strategy you can change (with defaults in () ):
RSI length (28)
RSI overbought level (85)
RSI oversell level (30)
Number of bars before leaving as explain above (28)
The choice to take longs only, shorts only or both
The number of coin/token by position
The start date for backtesting
Please note that the script use a pyramiding parameter of 3 (can be changed in the first line of the script); that means that you can take up to 3 positions before closing. It lets you improve average enter price but increase the risk. 3 is the best I found to improve profit factor without expose myself too much.
This script would be better if automated because of the conditions of buy and sell.
It's only for educative purpose, not an advice to invest.
All my free scripts here : fr.tradingview.com
Leave a message and don't forget to follow me ;) !

VWAP OscillatorToday I'm proposing a simple VWAP oscillator script to trade buy and sell waves more easily.
You trade this similar to how you trade Awesome Oscillator, so if you want an explanation just look up YT videos.
In addition to that, this will also show volume squeezes, please note that this is a makeshift way and not real volume squeeze phenomena of volume profile and tape. None the less, it is quite good at allowing you to ride out good trending waves and locate weak price action due to volume squeeze. You can turn off bar coloring from settings if you don't want this.
For ease of reading, I've also applied Allenstars Dynamic zones on this indicator so you can easily locate where the reading is entering in long and where it is in sell, this is compared to selected sample size. I've already selected the most common setting for that, so you don't really need to fiddle with it unless you find something better.
This indicator can be used to trade divergences as well, in fact, I feel it is better for that compared to RSI/MACD, the usual suspects.
Past performance is not assurance of future performance and this idea is published for only educational purposes, author taken no responsibility for your profit or loss.
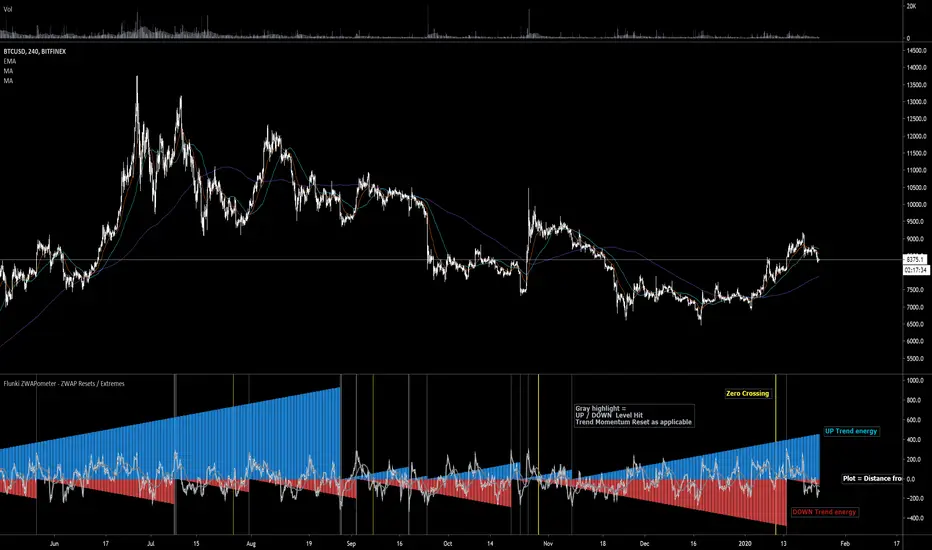
Flunki ZWAPometer - ZWAP Resets / Extremes
Here with another VWAP based indicator, this time using ZWAP (distance from VWAP) and flagging the extremities and crosses of each side, and graphing the bars since the last breach.
This basically gives a Bull / Bear energy / momentum
Yellow highlights = zero crossing , not entirely sure this is useful as of yet, but can give an early warning of a change - let me know if you find a genuine use for it !
Gray highlights = extreme reached, this generally signals exhaustion of the trend energy for Bull or Bear (depending on which side is reset obviously)
May develop further ; add bar colour options and more precise highlights, but only if it's of use to anyone.
Enjoy !
Flunkimoku
VWAPPIVWAPPI (Volume Weighted Average Price Performance Index) measures the strength of each trend using VWAP and various other factors. We can use the strength of the VWAPPI to plan entries and exits. It is also possible to play it's divergences.
Works on any market and on any timeframe.

VWAP OSCILLATORVWAP OSCILLATOR plots the difference between shorter time frame vwap and longer time frame vwap.
Preferred combinations are:
Daily chart - Weekly and Monthly or Monthly and Quarterly
Weekly chart - Quarterly and Yearly
Whenever VWAP OSC is above zero, shorts should never be taken.
Whenever VWAP OSC is below zero, longs should never be taken.
However it can also be used as a trend reversal set up. Whenever longer time frame vwap is sloping upwards and vwap oscillator is below zero and started to slope upwards, get ready to buy. Similar logic for shorts.