RSI w MA StrategyThis strategy is mostly for cryptocurrencies, it applies a moving average to an rsi and trades based on the crossings. It includes the indicator that it is made from.Estrategia Pine Script®por samovington66369
HiLo Extension This Strategy is finding high and low breaks of the day and enter into the trader based on RSI value and time value 1) This strategy is created for Indian Index like Nifty, Bank Nifty and so... 2) Trades are initiate only after 10:15 AM and before 3:10PM 3) High and Low of the day break will be check during the above time frame 4) RSI value will be check (RSI 50) 5) and trade will be initiate 6) Stop loss set as vwma 20... Note: This Script will work fine in Index future chart not index spot chart... This is just my idea only... Please back test yourselve, before using it.. Your comments are welcome! Estrategia Pine Script®por R_Saravanan_TE22259
MACD Crossover trend strategy, Long and ShortHey everybody, This is my first strategy and script I wrote mostly myself. There's tons of content out there to learn how to code in Pinescript and it's exactly what I wanted and needed in this time of my life. In any case, I made a rather simple MACD crossover strategy that only takes trades in the direction of both EMA and SMA (there are inputs to change the length of the moving averages and lots of other stuff too). If the MACD line crosses upwards on the signal line, while above the zero point of the histogram and the price is above EMA + SMA , it's a long signal. If the MACD line cosses downards on the signal line, while below zero on the histogram and the price is below EMA + SMA , it's a short signal. There are a lot of default variables that make no sense, for basically any symbol you're going to be looking at. You're going to have to adjust the EMA , SMA , backtest date, take profit, stop loss and all that good stuff yourself to find decently profitable parameters. I made this myself because I couldn't really find a strategy out there that allowed for so much customizing and it's an easy way to get started in Pinescript. If you have any suggestions, tips or you see a flatout mistake in my code, please let me know. I'm still learning, everyday and I'm enjoying every second of it.Estrategia Pine Script®por conflixx95493Actualizado 11306
Bull Market Trend Following StrategyThis Bull Market Trend Following Strategy is perfect for long or short term Crypto or traditional market trading and investing. It is based mainly on the ATR indicator and will therefore adapt to any market conditions and volatility. It has a number of variable options to try and maximise gains, including stop loss and take profit points, and the ability to wait for pullbacks. Please let me know if you find any optimal settings, and don't hesitate to ask any questions I'm always happy to help. Thanks a lot.Estrategia Pine Script®por BlockchainSpecialistsActualizado 66111
[KL] BOLL + MACD Strategy v2 (published)This strategy will look for opportunities when price touches the lower Bollinger band, then enters Long when it anticipates a MACD crossover signal. Setup: on 1-day chart interval Exits when either (a) hitting trailing stop loss, or (b) meeting risk-to-reward, if defined by user.Estrategia Pine Script®por DojiEmojiActualizado 33351
GG ES Scalp IBTT Momentum Strategy v1.0Script for Scalping the ES. Apply it to a 15 second chart. The Momentum Multiplier is a float input and the lower the number the less conservative the strategy is. It doesn't fire signals everyday but its pretty accurate. Send me a message to get access. CME_MINI:ES1!Estrategia Pine Script®por gggnetworksActualizado 3131166
[GBPUSD] DinhChienFX Swing [2 orders]* Take advantage of the 59% success rate of order 1 to enter position 2 with a higher Risk / reward ratio, - Command 1: risk / reward 1/1. 59% success percentage. - Order 2: risk / reward: 1 / 1.5 If you use Fibonacci retracement, it is 0.6 or 60%. Percent success 51.5%. - Percent profitable 2 orders: 55% - Number of consecutive wins in the past: 9. - Number of consecutive losses in the past: 6. So to avoid psychological influence, choose risk = 1% x6 = 6% for 1 trading signal. Currently, the Bot assumes 2% (orders 1: 1%, orders 2: 1%) ------- Max risk: 2%. 1. Trend identification: ... Keltner: Price through Upper1 / Lower 1 gives 1 point. ...... Uptrend: If price crosses over once, the close on Upper 1. ...... Downtrend: If the price crosses under once, closes below the Lower 1. ... Stochastic: ..... D> 67 for Buy, D <16 for Sell ... ADX: 30 indicates strong trend trend. ...... ADX smooth: 7. ...... DI length: 7. 2. Entry point: ... Buy (BUY): When k cut up D in an uptrend, when D> 67. ... Sell (SELL): When k cuts D in a downtrend, when D <16. Estrategia Pine Script®por dinhchien13
Risk Reduction Ultimate TemplateThis is a template not actually meant for trading. I picked two random oscillators. This is a template meant to turn into a live trading strategy, however. It's literally just a specialized take profit/stop loss system. It is to ensure your bot doesn't make any bad moves that you wouldn't have manually. The code should be pretty well annotated. Putting this into my scripts has made them much better. I will work on a Multiple Trigger template next.Estrategia Pine Script®por burgercrisis247
Flawless Victory Strategy - 15min BTC Machine Learning StrategyHello everyone, I am a heavy Python programmer bringing machine learning to TradingView. This 15 minute Bitcoin Long strategy was created using a machine learning library and 1 year of historical data in Python. Every parameter is hyper optimized to bring you the most profitable buy and sell signals for Bitcoin on the 15min chart. The historical Bitcoin data was gathered from Binance API, in case you want to know the best exchange to use this long strategy. It is a simple Bollinger Band and RSI strategy with two versions included in the tradingview settings. The first version has a Sharpe Ratio of 7.5 which is amazing, and the second version includes the best stop loss and take profit positions with a Sharpe Ratio of 2.5 . Let me talk a little bit more about how the strategy works. The buy signal is triggered when close price is less than lower Bollinger Band at Std Dev 1, and the RSI is greater than a certain value. The sell signal is triggered when close price is greater than upper Bollinger Band at Std Dev 1, and the RSI is greater than a certain value. What makes this strategy interesting is the parameters the Machine Learning library found when backtesting for the best Sharpe Ratio. I left my computer on for about 28 hours to fully backtest 5000 EPOCHS and get the results. I was able to create a great strategy that might be one of TradingView's best strategies out on the website today. I will continue to apply machine learning to all my strategies from here on forward. Please Let me know if you have any questions or certain strategies you would like me to hyper optimize for you. I'm always willing to create profitable strategies! P.S. You can always pyramid this strategy for more gains! I just don't add pyramiding when creating my strategies because I want to show you the true win/loss ratio based buying one time and one selling one time. I feel like when creating a strategy that includes pyramiding right off the bat falsifies the win rate. This is my way of being transparent with you all. Have fun trading!Estrategia Pine Script®por Trebor_NamorActualizado 199199 10.4 K
Bollinger bubble | Forex editionBollinger bubble is an edition for forex market. Work better en JPY pairs. We buy when a candle open & close outside the lower bollingers band and we target the last highest point on the last 10 candles. And we sell when a candle open & close outside the higher bollingers band we the target the last lowest point on the last 10 candles.Estrategia Pine Script®por UnknownUnicorn18067281119
Bollinger bubble | Stock EditionBollinger bubble is an edition for market like CAC40, DJ30, .. The market are uptrend with the inflation, this edition only buy (you have less risk then sell) We buy when a candle open & close outside the lower bollingers band and we target the last highest point on the last 10 candles.Estrategia Pine Script®por UnknownUnicorn18067281Actualizado 22148
hamster-bot PDD Pump and Dump DetectorPump and Dump detector by hamster-bot strategy author: foresterufa Pump and Dump detector (PDD) This is a trend strategy, with a unique mechanism of multi-stage re-entry into a position (Take Profit-Entry) when a significant trend develops, based on our HiDeep indicator. Positions are opened by the HiDeep indicator signal with trend direction filtering and volatility filtering. Positions are closed by a HiDeep indicator signal or a change in the trend direction. The position can be accompanied by a unique Stoploss trailing MA.Estrategia Pine Script®por hamster-bot55239
PROSTRATS Pine Script for Swing TradingThis is a simple script for swing trading. It uses my 2 favorite indicators; the Choppiness Index as well as Fibonacci Retracement. This script is meant to run on the 4 hour time frame, in my case I use BTCUSD. It will buy when 2 conditions are met. The first is that the Choppiness Index is above 54.5 on the Daily Time frame, which means the price has potential to swing high or low. I used the security() function to ensure this takes place on the daily time frame because larger time frames tend to dominate smaller time frames in terms of overall swings. The second condition is that the price has to cross above the 1 level of the Fibonacci Retracement. This ensures that the swing is going to be an upwards swing, as opposed to a downwards one. The measure I took to ensure that the Fibonacci Retracement level of 1 is above the 0 level is to make sure that the r value of the 1 level is greater than the r value of the 0 level. The sell condition is programmed to execute when either the price crosses above the 1.618 level(profit target) or cross below the 0 level(stop loss).Estrategia Pine Script®por andrew_allen11190
Companion::InsurgentCompanion::Insurgent is a combined indicators strategy. Performances are pretty good on 1D, 4H and 1H timeframes and it can be used on Bitcoin and Altcoin markets. Mainly, it is a trategy based on Ehlers formulas. Used indicators: - Ehlers Instantaneous Trend: trendline analysis; - Ehlers Super Bandpass Filter: momentum detection; - EMA: Long/Short time selector. What the script does: - determines trendlines combining mulitple indicators; - automaticlally calculates Take profit and Stop Loss levels; - permits automation generating Autoview signals (create an alert with {{strategy.order.alert_message}} in message text field to trap Autoview commands; - supports for margin trading. Spot trading will be added in the future. BACKTESTING Backtest is not leveraged. Defaults are set as follow: Capital: 10000 Percent of equity used for trades: 10% Commission: 0.18% this is Bitfinex commission on orders Change them accordingly on how you trade to get a more realistic backtest results. Estrategia Pine Script®por gianniaActualizado 29
Bollinger Band with RSI Using combination bollinger band and RSI indicator as guide to predict price volatility and the best entry point. The strategy logic is pretty straightforward where we're interested with close price that touches the lower bollinger band ; there are only two scenarios that will happened after the price reaches the lower band; the price might rebound from the lower bollinger band or drop lower and continue downtrend. To confirm the price movement, we use a second indicator which is the RSI to further investigate the price trend. For example, if the price reaches the lower bollinger band but the RSI value is not in the oversold region, we can conclude that the price will go lower and continue downtrend. If the RSI value is in the oversold region, we can use this price area as our entry point. Stop loss is necessary to avoid losing too much capital if the RSI value lingers too long in the oversold region. Best take profit area is when the price rebound above the middle bollinger band area/upper bollinger band or when the RSI reaches overbought region; whichever comes first. Long entry: RSI < 30 & close price < lower bollinger band Exit entry: RSI > 70 Default stop loss: -25%Estrategia Pine Script®por lolnoplsActualizado 3434 4.6 K
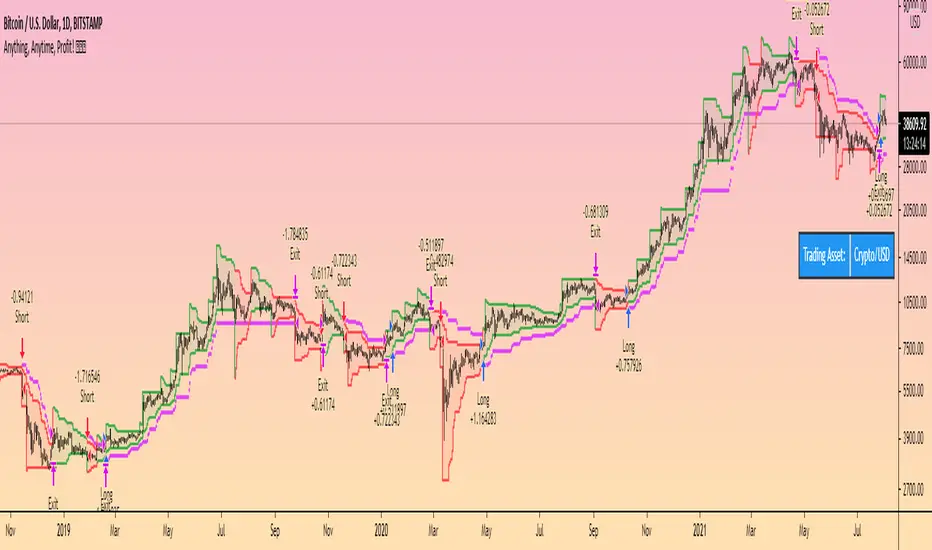
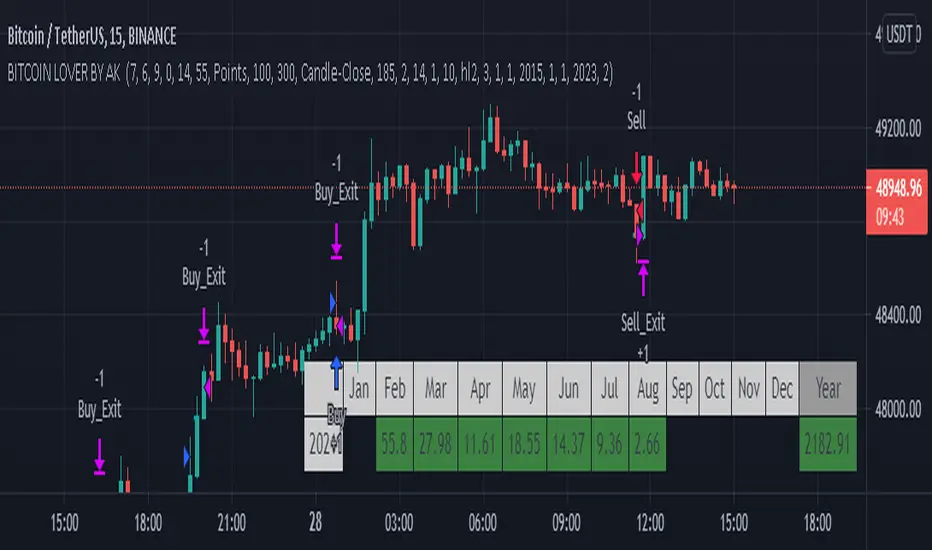
Bitcoin lover by Akthis strategy used to determine and anticipate potential changes in market price and reversals. The Highs referred to in the title are created based on the number of bars that exhibit lower highs on either side of a High, whereas the Lows are created based on the number of bars that exhibit higher lows on either side Low.it also analyzing price changes and reversals, a trader has more of an ability to determine and predict price patterns and general price trends...It take profit on pre define 500 points.. u can also change is take profit level. .and also added max intraday trades..so it help in risk management brokerage added 0.02% and slippage added 20. How it works?? It calculate swing on 5min chart.. When swing high is break it shows buy signal and when swing low is break it show sell signal.. And it book profit on 500 points.. U can also change profit points. .After booking profit if high or low of price break it again show buy and sell signal.. U can also use it with trend lines and moving average for better entry and exits.. I hope this will help trader for find out trends and profit booking and if u want to use it with comment strategy action you have to just add comment in comment box caution: always follow risk management before using strategyEstrategia Pine Script®por Aakashparikh787Actualizado 151568