Spring & Upthrust Trap (Zeiierman)█ Overview
Spring & Upthrust Trap (Zeiierman) is a Wyckoff-style “range sweep” indicator that highlights liquidity traps using a simple ZigZag pivot structure. It’s designed to catch the moment price briefly breaks a range boundary to trigger stops, then quickly snaps back into the range (rejection).
⚪ What It Detects
A Spring (Bull) is a downside fakeout. Price sweeps below the range boundary (taking liquidity), then rejects and returns back above the opposite boundary. In other words, it looks bearish for a moment, then flips bullish as the sweep fails.
An Upthrust (Bear) is the upside version. Price sweeps above the range boundary, then rejects and falls back through the opposite boundary. It looks bullish briefly, then flips bearish when that breakout fails.
█ How It Works
⚪ 1) Pivot Extraction (ZigZag Structure)
The script first compresses price into a small set of swing pivots using a ZigZag-style method driven by ZigZag Length. A bar becomes a pivot when it is the highest/lowest point inside the lookback window.
⚪ 2) Pattern Framing (X → A → B → C)
When there are at least four pivots available, the script maps the most recent pivot sequence into four labeled points:
X and A define the range boundaries (the box height is based on |A − X|)
B is the sweep pivot (the “fakeout” that breaks a boundary)
C is the rejection/snapback pivot that confirms the sweep failed
This is the minimum structure needed to define a trap without overfitting.
⚪ 3) Sweep Sizing (Filtering Noise vs Real Sweeps)
Not all boundary breaks are meaningful. The script measures sweep magnitude relative to the range size:
Sweep Fraction: |B − X| / |A − X|
This does two things:
Filters tiny pokes through a boundary (often random noise)
Filters extremely large breaks that are more likely to be true trend continuation rather than a trap
This is controlled by:
Min Sweep (minimum required violation)
Max Sweep (maximum allowed violation)
⚪ 4) Spring vs Upthrust Logic (Directional Trap Detection)
The script then decides which trap is forming:
Spring (Bull)
A downside sweep that fails: price breaks below the boundary, then returns strongly back through the opposite side.
Upthrust (Bear)
An upside sweep that fails: price breaks above the boundary, then returns strongly back through the opposite side.
█ How to Use
⚪ Interpreting a Spring (Bull)
A Spring is best treated as a failed breakdown. The sweep suggests stops were taken under the range, but the snapback implies that the market rejected lower prices.
Common behaviors after a good Spring:
fast reclaim back into the range
retest of the boundary from above (acceptance test)
continuation away from the sweep area if buyers remain in control
⚪ Interpreting an Upthrust (Bear)
An Upthrust is a failed breakout. Stops get taken above the range, but the price cannot hold outside and collapses back into/through the structure.
Common behaviors after a good Upthrust:
rejection wick and rapid return
retest of the boundary from below
continuation downward if sellers remain in control
█ Settings
ZigZag Length – pivot sensitivity. Higher = smoother, fewer signals. Lower = more pivots, more traps.
Show Patterns – detect Springs only, Upthrusts only, or both.
Min Sweep – minimum sweep size relative to range height (filters micro sweeps).
Max Sweep – maximum sweep size relative to range height (filters “real breaks”).
Confirm Pad – extra snapback requirement beyond the boundary (adds confirmation).
-----------------
Disclaimer
The content provided in my scripts, indicators, ideas, algorithms, and systems is for educational and informational purposes only. It does not constitute financial advice, investment recommendations, or a solicitation to buy or sell any financial instruments. I will not accept liability for any loss or damage, including without limitation any loss of profit, which may arise directly or indirectly from the use of or reliance on such information.
All investments involve risk, and the past performance of a security, industry, sector, market, financial product, trading strategy, backtest, or individual's trading does not guarantee future results or returns. Investors are fully responsible for any investment decisions they make. Such decisions should be based solely on an evaluation of their financial circumstances, investment objectives, risk tolerance, and liquidity needs.
Upthrust

Thrust CountThis counts the number of up or down thrusts over the previous N days and creates a total (up thrust - down thrust) to produce the graph.
It also optionally will include "run days" as part of the same count.
The idea is that it gives you an indication of the strength of the current trend (and can possibly help you spot it reversing ;))
For more on thrust days see:
And for more on run days see:

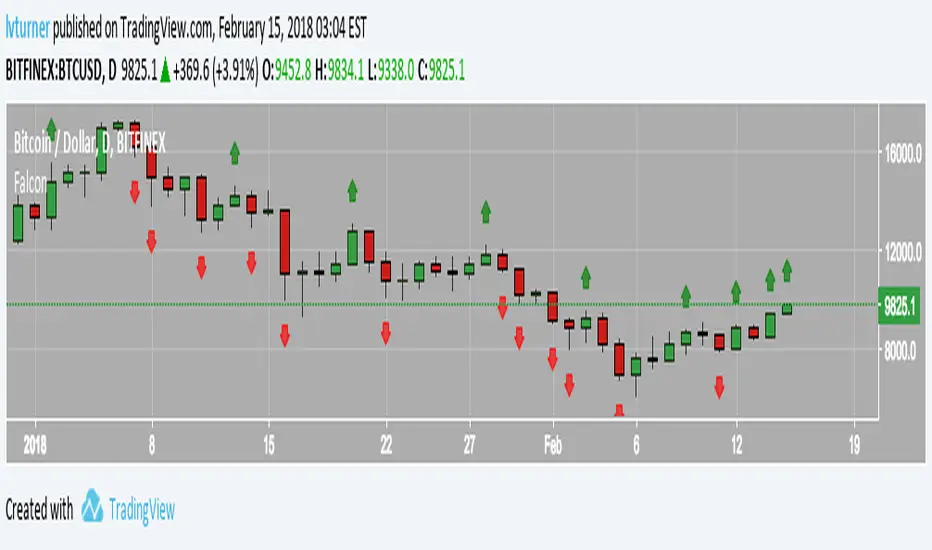
Falcon
Falcon highlights "Thrust Days"
A thrust day (as defined in Jack D. Schwager's book - A Complete Guide to the Futures Market: Technical Analysis, Trading Systems, Fundamental Analysis, Options, Spreads, and Trading Principles) is as follows:
"An upthrust day is a day with a close above the previous day's high, while a downtrhust day is a day with a close below the previous day's low"
It can be useful for determining the strength of a given trend (i.e. more upthrust days than downthrust days and it's a nice strong bull trend)
Enjoy!