VXMA BotThis strategy is separated version of Cloud MA form VXD Cloud Edition, Let called it "VXMA".
what's changed?
renew TP/SL Work
Simplify code and clean look.
Risk:Reward Calculation
Risk of Ruin Setting can now selected between Fixed $ or %
if Buy your Stoploss will be Swing low
if Sell your Stoploss will be Swing high and can be setting at Pivot Setting
then Auto Position Sizing and TP line will be calculated form there and will show in Orange color line (Draw Position Box is available)
Alert Setting
{{strategy.order.alert_message}}
Python-Bot
github.com
There are 2 mode : one-way mode and hedge mode is different script on my Github profile.
read README. MD and there's video tutorial.
Pls study app.py and it's script before deploy for your own safty and your own risk, I'm NOT responsible for your loss.
GOODLUCK
Trendtrading

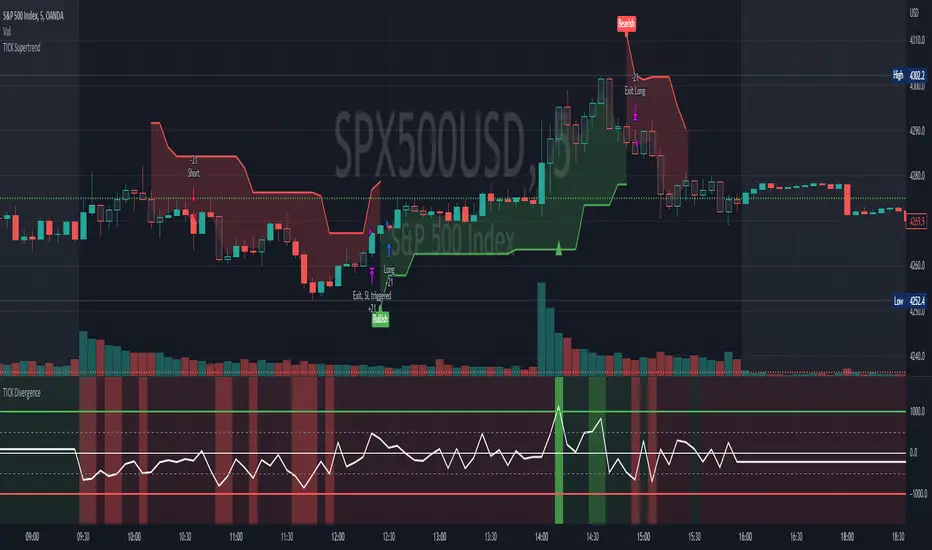
[Pt] TICK Supertrend Strategy, 5 minBackground:
It is well known that the indices such as SPY and QQQ follow/represent market sentiment. The TICK index literally represents the market sentiment as it compares the number of stocks that are rising and falling on the NYSE. By default, the TICK index is a short term indicator. Therefore it isn't reliable for swing trading or long term strategies. However, it is perfect for scalping.
Although TICK is well known, many does not know how to use it effectively. As part of the background mechanism of this script, I’ve divided TICK into 5 major zones based on the close of each candle: Overbought (neutral with bearish bias), Bullish, Neutral, Bearish, and Oversold (neutral with bullish bias). Along with the use of Heikin Ashi technique, RSI, moving averages and candle analysis, this strategy aims to provide accurate representation of market sentiment and profitable entry and exit points. *** At the time of publication, this strategy has proved to be consistently profitable. HOWEVER, this DOES NOT guarantee future profitability. So use at your own risk! ***
What is it showing?
This strategy is an intraday scalping strategy that uses TICK data to predict market directions for optimal entry and exit points. It is displayed similarly to the famous Supertrend indicator, which is one of the most common ATR based trailing stop indicators, so visually it is easy to read. This strategy is suitable for trading indices such as SPX , SPY , SPX500USD , QQQ , DJI and any other tickers that have high positive correlation with TICK.
Script is proprietary, but as mentioned it incorporates the following elements with additional candlestick analysis, pattern recognition, stop-loss and profit taking strategy:
- NYSE TICK data
- Heikin Ashi candle technique
- ATR
- RSI
- Moving Averages
Bullish trend is determined by a confluence of said indicators and analyses, and is displayed as a green line under the price action. The distance is defined by an adjustable value that is based on a percentage of the previous daily ATR value. When a long order is in play, that line also acts as the stop-loss level. Bearish trend is the opposite and is displayed in red, by default.
What's unique?
Detecting a ranging market structure and avoiding overtrading in a choppy market has always proven to be difficult, even for the most professional traders. This strategy has built-in “choppiness” and volatility filtering scripts that attempts to help reduce the number of false entries. These elements are what makes this strategy unique and different from other indictors mashup strategies.
In addition, this strategy takes previous trades into account and “learn” from past trades when determining the optimal stop-loss level to maximize profitability. This allows this strategy to better adapts to changing and evolving market conditions.
Strategy statistics
All parameters are designed for 5min time frame.
At the time of publication, this strategy has proved to be consistently profitable through limited back testing data.
Initial capital = $10000
Pyramiding = 1
Slippage = 3 ticks to account for spread
Default leverage shown = 9x
Quantity per trade = 100% of account
Back testing period at time of publication = Apr 11, 2022 - July 22, 2022
Trading Session = 1000 - 1530 Mon-Fri
Timeframe = 5 min
Gain = 1338.48%
Total trades = 253
% Profitable = 45.85%
Profit Factor = 2.506
Max Drawdown = 19.36%
Extras
This release includes default AutoView alerts for trading SPX500USD on Oanda. It includes both long and short order entry alerts, and trailing stop-loss alerts.
Please DM for free trial.
Rate Of Change Trend Strategy (ROC)This is very simple trend following or momentum strategy. If the price change over the past number of bars is positive, we buy. If the price change over the past number of bars is negative, we sell. This is surprisingly robust, simple, and effective especially on trendy markets such as cryptos.
Works for many markets such as:
INDEX:BTCUSD
INDEX:ETHUSD
SP:SPX
NASDAQ:NDX
NASDAQ:TSLA

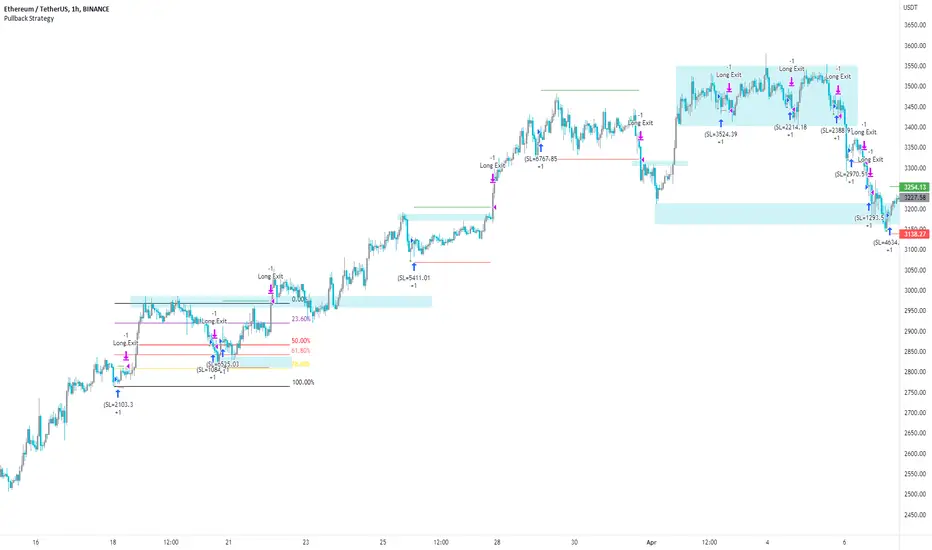
Pullback Strategy (Candle Analysis) New VersionFollowing on from the previous Pullback Candle which smashed over 100 likes - here we have the strategy behind the indicator.
Signal = Pullback Candle (This will alert on all timeframes and markets when selecting the Alert function for the Signal
Entry = When the Pullback Candle is confirmed ie 16:00 - the strategy will enter within the next two candles.
Stop loss = 0.25 ATR multiple which means we have a tighter stop loss - if greater than 1 then the stop loss will be more in percentages!!!
Take Profit = 1.5 Risk to Reward Model
Ema filter - There is a function to modify when looking into trades so as this is a bullish setup we want trades to be over the ema and using this filter will only show trades above the 200ema
Time filter - If you want to backtest Uptrends - locate the time of the start and the end of the uptrend - input this data into the settings and this will bring up the trades in that time period.
Most efficient to use this script is only in uptrends and this signal is a bullish signal - when using a ema filter we wont get trades under this so narrow down good trades for automation.
!!!!TO ENHANCE THE SYSTEM - USE TECHNICAL ANANLYSIS FOR CONFLUENCES
Most inefficient way to use the script is when price is in a downtrend and the win rate falls dramatically.
The pullback candle has a R-Expectancy of R5 so profits can be elongated when trading manually.
As the pullback candle occurs often in a trend we could pyramided trades to say have 5 trades in the same direction but the way i would trade this is to alert R1.5 then look to R2 and above to take profits manually.
(((P.S coders.... i need help to work on a profit extension code where exit long when price is below the 9ema (this seems simple but proving difficult) - this would be included onto the script if received.
SuperTrend Multiple Risk Management SystemThis is an improved SuperTrend strategy that makes use of multiple types of risk management options.
We have for example :
1. Take profit and stop loss levels based on support and resistence created with RSI and Pivot Lines(dynamic)
For example, if we have an oversold level and a pivot low , we can take that low point for support.(or resistence for short)
If instead we have an overbought level and a pivot high, we can take that high point for resistence.(orsupport for short)
2. Take profit and stop loss levels based on swing low and swing high points calculated with highest high and lowest low function(dynamic)
For example we take the lowest point in the last 100 candles. We calculate the distance from the current point to that one, and we apply this value as a take profit point. Same for stop loss
3. Take profit and stop loss levels based on % movements(fixed)
For example we have a tp or sl of 10%. If either of them make a movement of 10% from the entry point, they will get triggered.
4. Break even stop loss once the asset moves certain % in our direction.
For example we have a long breakeven of 5%. If the asset moves 5% in our direction, we move the stop loss on the entry point so if the trade pullback and crosses with this point it will exit from the trade.
Notes:
All the exits from the strategy are happening at the end of the candle close, since we are checking if inside the current candle we cross with either high or low of the candles parts the set prices from any of the above options.
At the same time we can combine multiple of them into one, and we can either exit based on which one was hit first, or use a quantity reduction of the trade and exit multiple times when we hit any of the levels.
This tool is for educational purpose only.
Its main purpose is to show the difference between having a risk management or without.
For example on this scenario of BTC USD 4h, I found out that the drawdawn was reduced by more than half when using different type of risk management, compared to not use one at all, while at the same time increasing the profits by a huge margin.

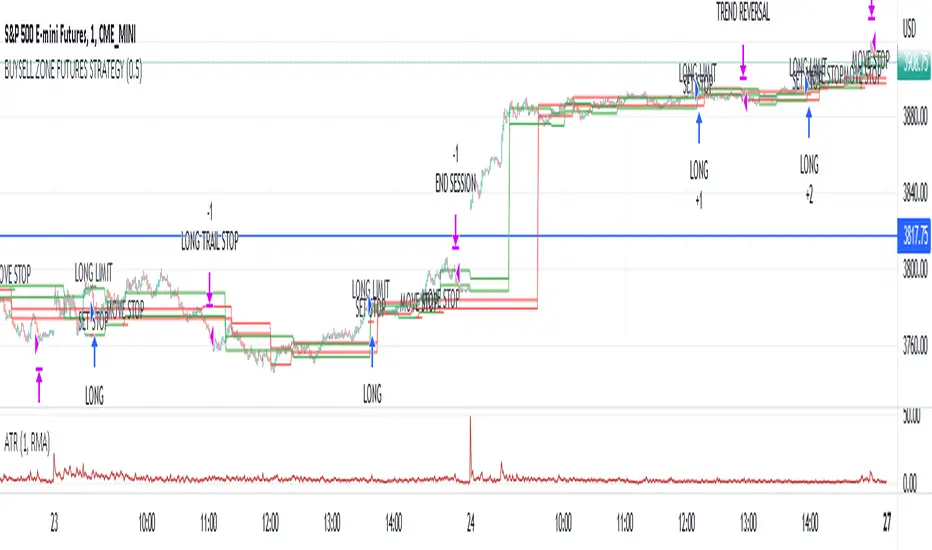
Market structure intraday ES futures strategy - BuySell ZonesThis market structure strategy for ES Mini Futures optimized for intraday market analysis ( RTH ).
Entry condition identified by bearish and bullish market structure.
Support level (Green Lines) is identified based on different variations of price fluctuations followed by the close above the range.
Resistance level (Red Lines) is identified based on different variations of price fluctuations followed by the close below the range.
The idea is to spot areas where market players were fighting for the best price and one side finally won.
Bullish trend is identified by consecutive series of support levels developing in upside direction.
Bearish trend is identified by consecutive series of resistance levels developing in downside direction.
When market develops bullish trend , strategy sets LONG limit order at fresh support level .
When market develops bearish trend , strategy sets SHORT limit order at fresh resistance level .
If there is an open position no new entries are performed.
For longs initial stop is set at previous support level adjusted by ATR.
For shorts stop is set at previous resistance level adjusted by ATR.
Stop trailing is also based on market structure.
If new support level is identified, stop moves to previous support level .
If new resistance level is identified, stop moves to previous resistance level .
There are no target. Strategy either gets stopped at current stop level or exits at session end.
Strategy calculates position size based on the previous market structure and ATR.
Strategy performs compounding position sizing so as account amount increases so does amount of traded contracts.
Usage:
Add script to your favorites and apply it on ES1! 1 minute time frame setting regular trading hours.
Script will print the limit order as well as stop levels according to the rules described above. As trade will progress, script will print levels to move the stop to.
Settings:
I added an option to disable the support and resistance lines printing if you prefer to have clean charts.
You can also change risk % to best fit your trading style.
If you just want to use the support and resistance levels as indicator you can also disable the strategy execution.
Support and Resistance indicator itself is universal and can be used on any market or timeframe.
If you want the strategy to be optimized for other markets or timeframes or have other rule set in mind feel free PM me, we will create the solution that best fits your needs and styles.
Real life trading is not get rich scheme. It is continuous process that involves various steps and dedication. If you are willing to take this path please PM me to enable the strategy for you.
Enjoy!
Classic Long Term Trend Following SystemThis is a classic long term trend following system.
The breakout period is 50 days instead of 20 and the moving average crossover are 40 and 120.
The moving averages are also exponential instead of simple.
The stoploss is 4 ATRs away from the price.
Recommendations:
Donchian Channels settings > 50 days
Moving Averages > 40 and 120, 80 and 140
Important to note:
My first strategy, DC Breakout System | This is simplicity at its finest, is best used on the crypto market and this one for stocks, commodities, currencies, etc. Those markets tend to trend a lot longer than crypto do.

Trend Following with Bollinger BandsThis is a trend following system which uses the Bollinger Bands instead of the Donchian Channels.
Long position:
* Price closes above the middle line.
* The fast EMA (in this case the 40) crosses over or is above the slow one (in this case the 120)
Short position:
* Price closes below the middle line.
* The fast EMA crosses under or is below the slow one.
Stoploss:
* 4 ATRs away from the price.

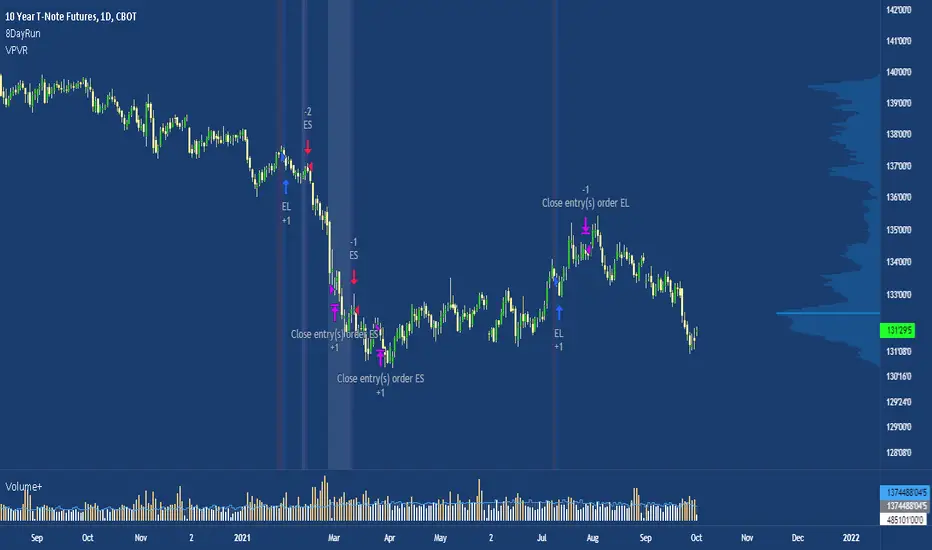
8 Day Extended Runs Inspired by Linda Bradford Raschke.
Strategy suited to the US T-note (ZN1!) with a t-test of 4.06.
The 5 day SMA is vital to Linda’s trend identification system. She’s done extensive testing and research using this indicator and has built models based on it. Linda used the 5 day SMA to determine that large outlier price moves happen in the direction of the trend in each market about 9-10 times per year. The powerful part about that number is that when the trend does persist, it can go on a long run, making this a trade with a high expected value.
Note: the current exit criteria is sell 10 days after entry, users should experiment with different stop placements.
WEEKLY BTC TRADING SCRYPTWeekly BTC Trading Scrypt(WBTS)
This script is only suggested for cryptocurrencies and weekly buying strategy which is long term.Using it in another markets(e.g forex,stock,e.t.c) is not suggested. The thing makes it different than other strategies we try to understand bull and bear seasons and buying selected crypto currency as using formula if weekly closing value crossover eight weeks simple moving avarage buy,else if selected crypto currency's weekly closing value crossunder eight weeks simple avarage sell. Eight week moving avarage is also uses weekly closing prices but for being able to use this strategy ,trading pair must have more than eight candles in weekly chart otherwise the 8 weeks simple moving avarage value cannot be calculated and script does not work.
This script has a chart called WBTS and it has following features:
Strategy group consist of 3 inputs:
1)Source: Close by default. Our whole strategy uses close values. You can change it but not suggested.
2)Loss Ratio: Because of the cases like the circumstances that manipulates market or high volatility , sometimes graphic show wrong buying signals and this ratio saves user from big money looses(Note : This ratio will always work when selling condition occurs to make user take his profit or prevent him to loss more money because of a wrong positive comes from the indicator.)
3)Reward Ratio : When selling condition happens it will exit user with more profit(if price is already higher than buying point) otherwise it will dimunish loss a bit(if user is below of buying point) or prevents looses(if user is in buying point when selling condition happened.
MA group consist of 2 inputs:
COLOR:Specifies color of the moving avarage.It is equal to #FF3232by hex color code by default.
LINE WIDTH: Specifies linewidth of the moving avarage. It is 2 by default.
GRAPHIC group consist of 2 inputs:
COLOR: It specifies the color of the line which consist of weekly closing prices. It is equal to #6666FF hex color code by default.
LINE WIDTH: Specifies linewidth of the line which consist of weekly closing prices. It is 2 by default.
STRATEGY EXECUTION YEAR: It will show the orders,profits and looses done by script after the input year giving in it.It is 2020 by default.
The last feature is strategy equity,it is not in one of these groups. User should click on settings button on the WBTS indicator than chose Style section and there is a deactivated check box near in the plot section if user activate it, the equity line will show in indicator's graph.
Logic of This Strategy:The story of this strategy began when I studied BTC's price movement from 2020 to today with 8 weeks simple moving avarage (it takes weekly closes as source) and weekly clossing values. I understood that there was a perfect interest between bull and bear market and following conditions:
buy_condition=crossover(weekly_closing_values,8_week_simple_moving_avarage)
sell_condition=crossover(weekly_closing_values,8_week_simple_moving_avarage)
and I tried same thing on the same and bigger time frames("for example i studied how the strategy works from the beginning to today with bitcoin and what is our final equity") with bitcoin and other cryptocurrencies and this made me saw better the relation between giving conditions and general market psychology, however I also witnessed some wrong positives coming by script and used a risk reward ratio to save user and set risk reward ratio 1/3 after a research.
For both conditions(buy_condition and sell_condition),when they are realised,script will alert users and an order will be triggered.
Before finishing the description,from settings/properties/ user can set initial capital,base currency,order size and type,but it is 100000 for initial_amount and 1 contract for order size by default.
In backtesting I used the options like the following example :
Initial capital=1000
Base_curreny=USD
Order size=40 USD
Properties place must set different by every single user according to his or her capital and order size must not be higher than his total money because this script is not the best or a good script for derivatives. It is only written for long term-crypto spot trading and I strongly recommend to users that margin may cause bad results and please do not use it with any margin or any market different than crypto market.
Thank you very much for reading)

Traffic Lights Strategy4HS Crypto Market Strategy
This strategy uses 4 ema to get Long or Short Signals
Length are: 4, 9, 18, 100
We take long positions when the order of the emas is the following:
green > yellow > red (As the color of Traffic Lights) and they are above white ema (Used as a filter for long positions)
We take short positions when the order of the emas is the following:
green < yellow < red (As the color of inverse Traffic Lights) and they are below white ema (Used as a filter for short positions)
Enable Long and/or Short Positions in settings
Enable Profit and Stop in strategy settings with different percentage to backtest the strategy. Also if it is better to use a Traditional Stop Loss or a Trailing Stop Loss based on ATR
Change ema filter resolution in settings for better strategy performance
This Strategy was tested on Crypto Market with good results in assets as BTC, ETH, BNB, ADA, LTC, XLM, BCH, among others
Feel free to optimize this strategy, optimizing its parameters. Each asset has its own "personality".

Ichimoku Cloud Strategy IdeaThis strategy idea uses the famous Ichimoku Cloud (Forward-shifted SMA-9 and SMA-26) and Chiku (52-candle lagged close price) with its default parameters. This strategy is slow and issues few signals. However, this is one of the most performant long-term trend trading strategies. It usually works well on 1D and 4H timeframes and even better on trending instruments. This is the implementation used in QuantCT app.
You can set operation mode to be Long/Short or long-only.
You also can set a fixed stop-loss or ignore it so that the strategy act solely based on entry and exit signals.
Trade Idea
When both close price and chiku are above the cloud, market is considered rising (bullish) and the plotted cloud becomes green.
When both close price and chiku are below the cloud, market is considered falling (bearish) and the plotted cloud becomes red.
Otherwise, market is considered ranging and the plotted cloud becomes orange.
Entry/Exit rules
Enter LONG right after both close price and chiku went above the cloud (i.e. when the end of the plotted cloud becomes green).
Enter SHORT right after both close price and chiku went below the cloud (i.e. when the end of the plotted cloud becomes red).
EXIT market when close price enters the cloud.
CAUTION
It's just a bare trading idea - but a profitable one. You can enhance this idea and turn it into a full trading strategy with enhanced risk/money management and optimizing it, and you ABSOLUTELY should do this!
DON'T insist on using Long/Short mode on all instruments! This strategy performs much better in Long-Only mode on several instruments (Like BTC , ETH, etc.), and also performs better in Long/Short mode on other instruments (Like VET, BNT, etc.).

Momentum Trading By Mahfuz AzimA following indicator is Momentum Trading that uses fast QQE crosses with Moving Averages
Use for trend direction filtering. QQE or Qualitative Quantitative Estimation is based
Relative strength index (RSI), but uses a smoothing technique as an additional transformation. Three crosses can be selected (all selected by default)

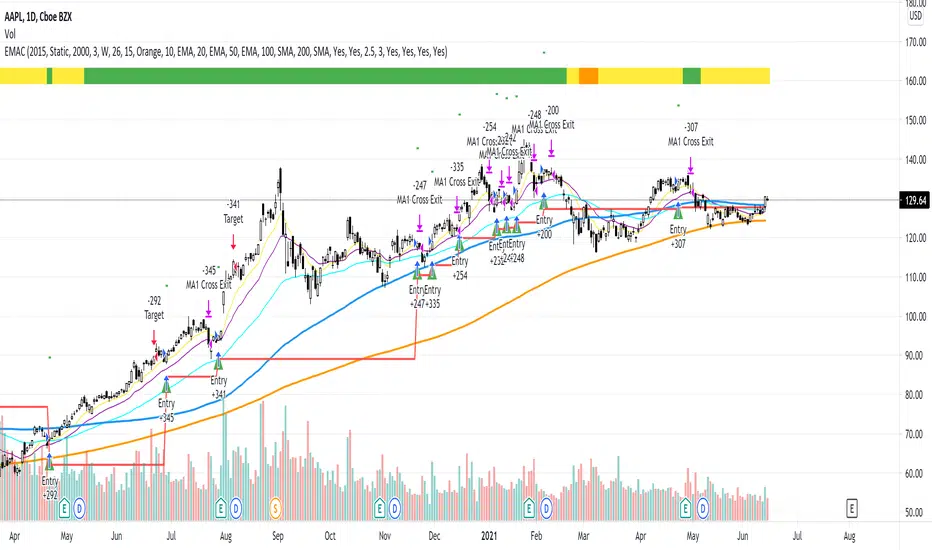
EMAC - Exponential Moving Average Cross - OptimizedEMAC - Exponential Moving Average Cross - Optimized
This is the full Strategy version with the best currently known optimized inputs with the average best settings across the following 26 tickers:
QQQ
TQQQ
SPY
SPXL
AAPL
AMZN
TSLA
BYND
CRWD
DDOG
ESTC
FSLY
MDB
NVDA
PINS
PTON
ROKU
SHOP
SQ
TDOC
TWLO
APPS
CHWY
DKNG
ETSY
FVRR
For the short Study version of EMAC that has been optimized for TradersPost alerts only please see EMAC - Exponential Moving Average Cross - Study
For the original full Strategy version with many editable inputs please see EMAC - Exponential Moving Average Cross

EMAC - Exponential Moving Average CrossEMAC - Exponential Moving Average Cross
This strategy is based in part on original 10ema Basic Swing Trade Strategy by Matt Delong: www.tradingview.com
Link to original 10ema Basic Swing Trade Strategy:
This is the Original EMAC - Exponential Moving Average Cross strategy built as a class for reallifetrading dot com and so has all the default settings and has not been optimized. I would not recommend using this strategy with the default settings and is for educational purposes only. For the fully optimized version please come back around the same time tomorrow 6/16/21 for the EMAC - Exponential Moving Average Cross - Optimized
If you have any questions feel free to reach out to me with a comment and I will try to get back to you quickly with a reply.
Donchian Channel StrategyRide the trend with full potential. Filter out false signals using long period ema. Lower bands take care of the stop loss.
Use this strategy for banknifty futures for consistent quarterly returns.

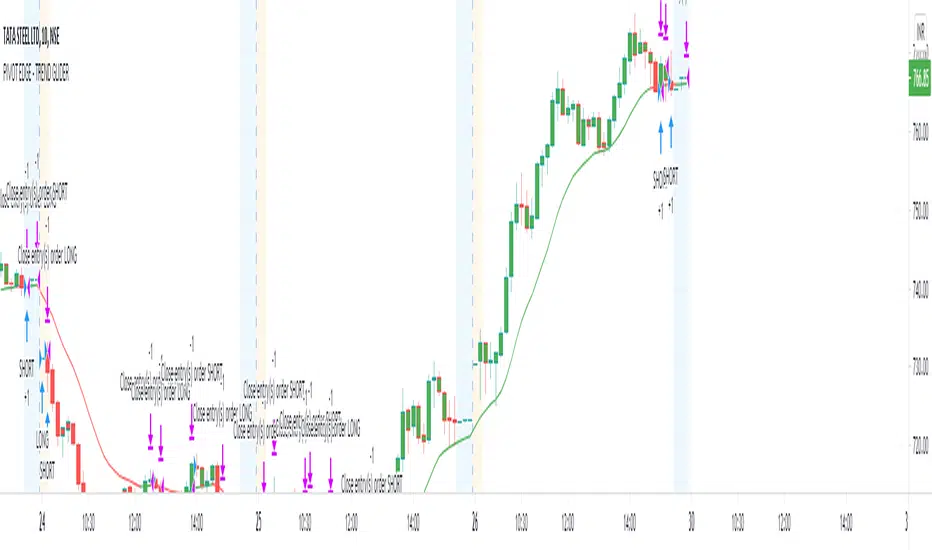
PIVOT EDGE - TREND GLIDEROne of the Biggest challenge in trading is to find the right trend and once we are in the right trend, holding on to winning trades is the next challenge. So this indicator addresses both these issues and helps you with
finding the right trend and also guide you and glide the trades till there is a change in trend by means of proper trend based candle color.
You can just look at the basic candle color as per the prevailing trend and be in the trend as long as the candle colors doesn't change. You need not worry or panic about the small pullbacks or retracements which is a normal
course of any trend continuation. Without this Indicator, in normal situation we would have ended our trades thinking the trend has changed and only to find that trend is again continuing and giving us more than 3-4 times reward after exit.
This Indicator is coded in such a way that no matter what may be the standard color of the candle, This Indicator will paint the candles to Green color in an Uptrend and it will paint the candles RED color in downtrend.
You can take entries as soon as you see the trend formation and wait till the trend is changed or the candle color is changed.
This indicator is intended for the use of newbies or Novice traders to give them confidence and also to guide them towards the proper trend so that they are not taking any counter trend trades.
This Indicator is also beneficial for experienced and master traders to keep them in trade and glide until there is a clear change in trend thereby riding their profits for longer time.
This is a Moving average crossover based strategy but slightly different in the computation where in I have used the customized PEMA values to suit most favorable win ratio.
The results are best when used for timeframe of 10 mins and above. Also you must know the basics of candle stick patterns and price action to take suitable entries and exit at favorable risk reward ratio.
Always do not wait for exit signal from the indicator. You can exit whenever you have gained decent profit and you can keep a trailing stop loss and lock in your profit.
This Indicator works on all Markets and all types of timeframes. Kindly do backtesting for atleast 2-3 months data before using it for live market. Also you must find out which stocks you wish to trade and check if this indicator works favorably for your scripts. The results might slightly vary on stocks
with high volatility.
Always look for the curve in trending up direction of trending down direction. Do not trade whenever the curve is flat and not inclined upside or downside.
Always trade with a suitable STOPLOSS in place and trade with less quantity till you find comfort and confidence with this Indicator.
Further updates to follow periodically. Incase you like this script, like it and share it to others too. Also take a look at the other scripts that I have published.
Happy Trading
Mohan
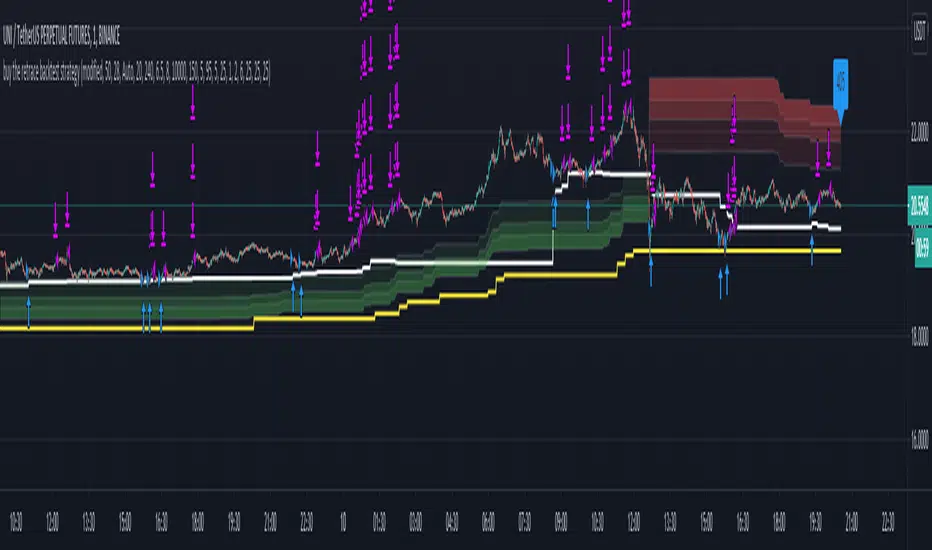
Buy The Retrace backtest strategyA trend-following strategy entering pullbacks
Simple but efficient
Mostly used it on 1 min chart but it works extremely well on 5 min as well.
The components of the strategy:
-MTF ATR based Trend
-Fib based cloud to help determine the trend - Caution when trend and cloud shows a different trend - a reversal may be possible.
-Optional values for the signals -how often you would like to get one- can be changed based on - the current close relative to the close-only high-low range over a given period of time.
-3x take profit levels
- all adjustable in %
- take profit quantities adjustable in % for each level
-paints a line where your average position is
-labels the current position size
Be careful where the cloud is broken, a reversal may happen.
Be careful longing / shorting the same levels which acted as a support/resistance before - this is why the win ratio is around 80% only as a small percentage gets stopped out usually.
Would like to get access? Pm me I'll grant it.
MACD TRADING SYSTEMThis is a conservative Trend Continuation Trading System.
Uses a Hull Moving Average to determine general trend direction
Uses MACD to initiate Trade entries
Uses a variant of Chaikin Money Flow for volume confirmation
Also uses the Average True Range (ATR) to determine take profit and stoploss.
Stoploss becomes trailing when take profit target has been hit.
I built it mainly for myself to use.
Wanted an objective trading system to take all the emotions out of my trading.

TrendMaAlignmentStrategy - Long term tradesThis is another strategy based on moving average alignment and HighLow periods. This is more suitable for long term trend traders and mainly for stocks.
Candle is colored lime if : Lookback Period has at least one bar with moving averages fully aligned OR None of the bars in Lookback periods has negatively aligned moving averages (More than half are positively aligned).
Candle is colored orange if : Lookback Period has at least one bar with moving averages fully aligned in negative way OR none of the bars in lookback has positively aligned moving averages (More than half are negatively aligned).
If either of above conditions are met, candle is colored silver.
Moving average alignment parameters:
Moving Average Type : MA Type for calculating Aligned Moving Average Index
Lookback Period : Lookback period to check highest and lowest Moving Average index.
HighLow parameters:
Short High/Low Period: Short period to check highs and lows
Long High/Low Period: Longer Period to check highs and lows.
If short period high == long period high, which means, instrument has made new high in the short period.
ATR Parameters:
ATR Length: ATR periods
StopMultiplyer: To set stop loss.
ReentryStopMultiplyer: This is used when signal is green buy stop loss on previous trade is hit. In such cases, new order will not be placed until it has certain distance from stop line.
Trade Prameters:
Exit on Signal : To be used with caution. Enabling it will allow us to get out on bad trades early and helps exit trades in long consolidation periods. But, this may also cause early exit in the trend. If instrument is trending nicely, it is better to keep this setting unchecked.
Trade direction : Default is long only. Short trades are not so successful in backtest. Use it with caution.
Backtest years : limit backtesting to certain years.
Part of the logic used from study's below:
Other strategies based on these two studies are below (which are meant for short - medium terms):

Breakout Trend Trading Strategy - V2This is an alternate version of Breakout Trend Trading Strategy - V1
Only difference is, this strategy places stop orders based on calculated targets whereas V1 waits for price to close target levels and then places market orders. Hence, you will receive the target prices before trade executes in strategy.
Parameters are same as that of Breakout Trend Trading Strategy - V1
There is one additional parameter on Trade Type - which permits user to allow only breakout, pullback or reverse trading or combination of all.
Backtesting parameters remain same :
Capital and position sizing : Capital and position sizing parameters are set to test investing 2000 wholly on certain stock without compounding.
Initial Capital : 2000
Order Size : 100% of equity
Pyramiding : 1
Test cases remain same :
Positive : AAPL , AMZN , TSLA , RUN, VRT , ASX:APT
Negative Test Cases: WPL , WHC , NHC , WOW, COL, NAB (All ASX stocks)
Special test case: WDI
Negative test cases still show losses in back-testing. I have attempted including many conditions to eliminate or reduce the loss. But, further efforts has resulted in reduction in profits in positive cases as well. Still experimenting. Will update whenever I find improvements. Comments and suggestions welcome :)

Breakout Trend Trading Strategy - V1Strategy in nutshell:
This strategy is made to be used in daily time-frames. Works better on trending instruments where volume is available. Hence, this is more suitable for trending shares rather than currencies, commodities and indexes where volume data is either not present or not reliable.
Breakout signifies the continuation of trend. Hence, trade in the direction of breakouts. Breakouts are calculated based on high volume and price movement in a day. This will be combined with few other conditions to generate buy and sell signals along with stop and compound targets. Supertrend is used for trend bias. Our buy and sell targets do not directly depend on the bias. But, entry criteria in opposite trend is made much difficult than that of trend direction. Further explanation of method and input parameters are explained below.
Backtesting parameters :
Capital and position sizing : Capital and position sizing parameters are set to test investing 2000 wholly on certain stock without compounding.
Initial Capital : 2000
Order Size : 100% of equity
Pyramiding : 1
ExitOnSignal : If unchecked exit is triggered solely on trailing stop
Trade Direction : Long, Short or All. Short condition is riskier than long conditions and often results in losses as per my observation. On most of the stocks trending up, strategy will not generate any short signals. This is achieved by comparing yearly high lows to previous two years to decide whether to allow short or long entries.
allowImmediateCompound : Applicable only if compounding/pyramiding is enabled in trade. If checked allows to place compounding orders immediately. If unchecked, it waits for stopline to cross order price before placing next compound.
Display Mode :
Targets : Whenever breakout happens, show marker for upTarget and downTarget
TargetChannel : Show up target and downtarget as a channel
Target With Stop : Along with targets, show also stop levels for breakouts
Up Channel : Channel created from UpTarget and respective stops
Down Channel : Channel created from DownTarget and respective stops
ShowTrailingStop : Shows trailing stop and compound lines when there is a trading position.
ShowTargetLevels : Shows Buy Sell target levels along with stop and compound lines. Trades are done as market orders. Hence, target levels are displayed after strategy makes the trade. Since only one order allowed per side without compounding, target, stop and compound levels are shown sometimes even without trade being made. These can be considered as entry levels if there is no existing position.
ShowPreviousLevels : Shows previous buy/sell target levels. When enabled, layout can look messy.
StopMultiplyer: To Set trailing stop loss.
BacktestYears: Number of years to include in backtest
So far my test cases are:
Positive : AAPL, AMZN, TSLA, RUN, VRT, ASX:APT
Negative Test Cases: WPL, WHC, NHC, WOW, COL, NAB (All ASX stocks)
Special test case: WDI
Negative test cases still show losses in backtesting. I have attempted including many conditions to eliminate or reduce the loss. But, further efforts has resulted in reduction in profits in positive cases as well. Still experimenting. Will update whenever I find improvements. Comments and suggestions welcome :)

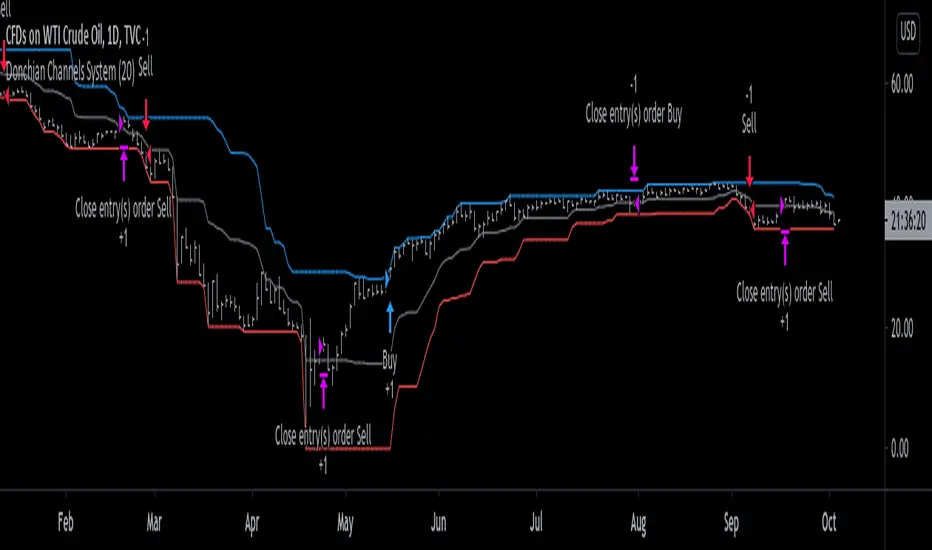
Donchian Channels System [racer8]Donchian Channels was developed by Richard Donchian in 1949. They have been used with great success by the Turtles, a group of traders in the 1980s who managed to obtain returns of 80% annually. Truly incredible story.
This particular indicator is a trend trading system I coded that shows you when to enter long or short and when to exit those longs or shorts.
In addition, this indicator shows the past performance results that are incredibly valuable information for backtesting this system.
The high, mid, and low lines have been plotted to show how this system works. The blue line is the high line. The gray line is the mid line. The red line is the low line.
Entry signals are generated when the current close closes above the highest price for a long trade or below the lowest price for a short trade over n periods.
Exit signals are generated when the current close crosses the mid-line (aka. baseline) and closes.
Baseline = (highest price + lowest price)/2
I encourage you to play around with the settings, although I reccomend avoiding any period below 14.
This system is no bullshit, it's the real deal.
Good luck traders, and enjoy ;)