[GYTS-Pro] Market Regime Detector🧊 Market Regime Detector (Professional Edition)
🌸 Part of GoemonYae Trading System (GYTS) 🌸
🌸 --------- INTRODUCTION --------- 🌸
💮 What is the Market Regime Detector?
The Market Regime Detector (Pro) is an elite, consensus-based market state analyzer designed to filter noise and identify the true underlying market structure. By distinguishing between trending (bullish or bearish) and cyclic (range-bound) market conditions with high precision, this detector acts as the "brain" of your trading system. Instead of forcing a single strategy across incompatible market conditions, the detector empowers you to deploy the right tactic at exactly the right time.
💮 The Importance of Market Regimes
Markets constantly shift between different behavioural states or "regimes":
• Bullish trending markets - characterised by sustained upward price movement
• Bearish trending markets - characterised by sustained downward price movement
• Cyclic markets - characterised by range-bound, oscillating behaviour
Each regime requires fundamentally different trading approaches. Trend-following strategies excel in trending markets but fail in cyclic ones, while mean-reversion strategies shine in cyclic markets but underperform in trending conditions. However, detecting these regimes is easier said than done, and we have gone through hundreds of hours of testing to create the Market Regime Detector, using multiple very sophisticated methods in an easy-to-use indicator.
💮 Professional vs Community Edition
The Market Regime Detector comes in two versions: a comprehensive Professional Edition and a streamlined Community Edition.
Key advantages of the Professional Edition:
• Enhanced detection accuracy - Utilises 5 advanced detection methods (compared to only 2 in the CE version)
• Proprietary cycle measurement - Automatically detects the market's dominant cycle instead of requiring manual input
• Superior consensus mechanism - Includes a unique "strength-weighted decision" mode that gives more influence to stronger signals
• Reduced false signals - Multiple complementary methods working together provide more reliable regime identification
• Advanced DSP algorithms - Implements sophisticated digital signal processing techniques for superior market analysis
The Professional Edition delivers significant improvements in detection accuracy, signal stability, and overall trading performance.
🌸 --------- KEY FEATURES --------- 🌸
💮 Consensus-Based Detection
Rather than relying on a single method, our detector employs multiple complementary detection methodologies that analyse different aspects of market behaviour:
• Advanced digital signal processing techniques
• Volatility and momentum analysis
• Adaptive filters and mathematical transformations
• Cycle identification
• Channel breakout detection
These diverse perspectives are synthesised into a robust consensus that minimises false signals while maintaining responsiveness to genuine regime changes.
💮 Proprietary Dominant Cycle Measurement ( Pro Edition only )
At the heart of our Professional Edition detector is a proprietary dominant cycle measurement system that automatically and adaptively identifies the market's natural rhythm. This system provides a stable reference framework that continuously adapts to changing market conditions while avoiding the erratic behaviour of typical cycle-finding algorithms like Hilbert Transforms, Discrete Fourier Transforms, or autocorrelation measurements.
Unlike the Community Edition which requires manual input of a single, constant dominant cycle period, the Professional Edition automatically detects and continuously adapts this critical parameter. This automated and adaptive approach ensures optimal detection accuracy across different markets and timeframes without requiring user expertise in cycle analysis, and provides significantly better responsiveness to evolving market conditions.
💮 Intuitive Parameter System
We've distilled complex technical parameters into intuitive controls that traders can easily understand:
• Adaptability - how quickly the detector responds to changing market conditions
• Sensitivity - how readily the detector identifies transitions between regimes
• Consensus requirement - how much agreement is needed among detection methods
This approach makes the detector accessible to traders of all experience levels while preserving the power of the underlying algorithms.
💮 Visual Market Feedback
The detector provides clear visual feedback about the current market regime through:
• Colour-coded chart backgrounds (purple shades for bullish, pink for bearish, yellow for cyclic)
• Colour-coded price bars
• Strength indicators showing the degree of consensus
• Customisable color schemes to match your preferences or trading system
💮 Integration in the GYTS suite
What is of paramount importance, is that the Market Regime Detector is compatible with the GYTS Suite , i.e. it passes the regime into the Order Orchestrator where you can set how to trade the trending and cyclic regime. The intention is to integrate it with more indicators.
🌸 --------- CONFIGURATION SETTINGS --------- 🌸
💮 Adaptability
Controls how quickly the Market Regime detector adapts to changing market conditions. You can see it as a low-frequency, long-term change parameter:
• Very Low: Very slow adaptation, most stable but may miss regime changes
• Low: Slower adaptation, more stability but less responsiveness
• Normal: Balanced between stability and responsiveness
• High: Faster adaptation, more responsive but less stable
• Very High: Very fast adaptation, highly responsive but may generate false signals
This setting affects lookback periods and filter parameters across all detection methods.
💮 Sensitivity
Controls the conviction threshold required to trigger a regime change. This acts as a high-frequency, short-term filter for market noise:
• Very Low: Requires overwhelming evidence to identify a regime change.
• Low: Prioritizes stability; reduces false signals but may delay transition detection.
• Normal: Balanced sensitivity suitable for most liquid markets.
• High: Highly responsive; detects subtle regime changes early but may react to market noise.
• Very High: Extremely sensitive; detects minor fluctuations immediately.
Pro Feature Note: In the Strength-Weighted Decision mode, this setting acts as a dynamic calibrator. It not only adjusts individual method thresholds but also scales the global consensus threshold . A 'High' sensitivity lowers the barrier for the weighted consensus, allowing the system to react to early-stage breakouts even if not all methods fully agree yet.
💮 Consensus Mode
Determines how the signals from all detection methods are combined to produce the final market regime:
• Any Method (OR) : Signals bullish/bearish if any method detects that regime. If methods conflict, the stronger signal wins. More sensitive, catches more regime changes but may produce more false signals.
• All Methods (AND) : Signals only when all methods agree on the regime. More conservative, reduces false signals but might miss some legitimate regime changes.
• Weighted Decision : Balances all methods with equal voting rights. Signals bullish/bearish when the weighted consensus reaches a fixed majority (0.5). Provides a middle ground between sensitivity and stability.
• Strength-Weighted Decision ( Pro Edition only ): A "meritocratic" approach where methods reporting extreme confidence (high signal strength) are given proportionally more weight than those reporting weak signals. Unlike standard voting, a single clear signal from a highly reliable method can override indecision from others.
Note: The threshold for this decision is dynamically calibrated by your 'Sensitivity' setting, ensuring the logic adapts to your desired risk profile.
Each mode also calculates a continuous regime strength value that drives the color intensity in the 'unconstrained' display mode, giving you a visual heatmap of trend conviction.
💮 Display Mode
Choose how to display the market regime colours:
• Unconstrained regime: Shows the regime strength as a continuous gradient. This provides more nuanced visualisation where the intensity of the color indicates the strength of the trend.
• Consensus only: Shows only the final consensus regime with fixed colours based on the detected regime type.
The background and bar colours will change to indicate the current market regime:
• Purple shades : Bullish trending market. In 'unconstrained' mode, darker purple indicates a stronger bullish trend.
• Pink shades : Bearish trending market. In 'unconstrained' mode, darker pink indicates a stronger bearish trend.
• Yellow : Cyclic (range-bound) market.
💮 Custom Color Options
The Market Regime Detector allows you to customize the color scheme to match your personal preferences or to coordinate with other indicators:
• Use custom colours: Toggle to enable your own color choices instead of the default scheme
• Transparency: Adjust the transparency level of all regime colours
• Bullish colours: Define custom colours for strong, medium, weak, and very weak bullish trends
• Bearish colours: Define custom colours for strong, medium, weak, and very weak bearish trends
• Cyclic color: Define a custom color for cyclic (range-bound) market conditions
🌸 --------- DETECTION METHODS --------- 🌸
💮 Five-Method Consensus Architecture
The Professional Edition employs a sophisticated multi-stage architecture to determine market regimes with high precision.
The detection process flows through four logical stages:
1. Market Data & Cycle Detection
Price data flows into the system where the Dominant Cycle Detector automatically identifies the market's natural rhythm. This adaptive cycle length calibrates all subsequent calculations, ensuring the detector remains in sync with changing market conditions without manual adjustments.
2. Five Detection Methods
Using the detected cycle, five complementary algorithms independently evaluate the market state:
• Cyclic Centroid Analysis : Calculates the market's 'centre point' over its dominant cycle and measures price displacement to determine trend or equilibrium.
• Spectral Momentum : Measures momentum across the market's frequency spectrum to identify trend concentration.
• Energy Distribution Gauge : Gauges how price movement energy is distributed to flag cyclic or trending states.
• Volatility Channel : Models the market's volatility state, using band breakouts to indicate a trend.
• Phase Coherence Detector : Analyses phase relationships between adaptive low-pass filters to detect trend stability and identify early regime shifts.
3. Consensus Engine
The signals from all five methods are fed into the Consensus Engine. Depending on your configuration, it aggregates these votes using one of four logic modes (Any, All, Weighted, or Strength-Weighted) to filter out noise and confirm the true market regime.
4. Regime Output
The final result is broadcast as a clear market state:
• Bullish (1) : Trending upwards
• Bearish (-1) : Trending downwards
• Cyclic (0) : Range-bound or oscillating
This output drives the visual feedback on your chart and can be streamed directly to the Order Orchestrator for automated strategy switching.
💮 Synergy & Complementarity
What makes these methods powerful is not just their individual sophistication, but how they complement one another:
• Some excel at early detection while others provide confirmation
• Some analyse time-domain behaviour while others work in the frequency domain
• Some focus on momentum characteristics while others assess volatility patterns
• Some respond quickly to changes while others filter out market noise
This creates a comprehensive analytical framework that can detect regime changes more accurately than any single method. All methods utilize the automatically detected and continuously adaptive dominant cycle period, ensuring they remain precisely calibrated to current market conditions without manual intervention.
🌸 --------- USAGE GUIDE --------- 🌸
💮 Starting with Default Settings
The default settings (Normal for Adaptability, Sensitivity, and Consensus) provide a balanced starting point suitable for most markets and timeframes. Begin by observing how these settings identify regimes in your preferred instruments.
💮 Adjusting Parameters
• If you notice too many regime changes → Decrease Sensitivity or increase Consensus requirement
• If regime changes seem delayed → Increase Adaptability
• If a trending regime is not detected, the market is automatically assigned to be in a cyclic state. The majority of methods actually measure this explicitly.
• If you want to see more nuanced regime transitions → Try the "unconstrained" display mode (note that this will not affect the output to other indicators)
💮 Trading Applications
Regime-Specific Strategies:
• Bullish Trending Regime - Use trend-following strategies, trail stops wider, focus on breakouts, consider holding positions longer, and emphasise buying dips
• Bearish Trending Regime - Consider shorts, tighter stops, focus on breakdown points, sell rallies, implement downside protection, and reduce position sizes
• Cyclic Regime - Apply mean-reversion strategies, trade range boundaries, apply oscillators, target definable support/resistance levels, and use profit-taking at extremes
Strategy Switching:
Create a set of rules for each market regime and switch between them based on the detector's signal. This approach can significantly improve performance compared to applying a single strategy across all market conditions. The Pro Edition's multiple detection methods and advanced consensus mechanisms provide more reliable regime transitions, leading to better strategy switching decisions.
GYTS Suite Integration:
• In the GYTS 🎼 Order Orchestrator, select the '🔗 STREAM-int 🧊 Market Regime' as the market regime source
• Note that the consensus output (i.e. not the "unconstrained" display) will be used in this stream
• Create different strategies for trending (bullish/bearish) and cyclic regimes. The GYTS 🎼 Order Orchestrator is specifically made for this.
• The output stream is actually very simple, and can possibly be used in indicators and strategies as well. It outputs 1 for bullish, -1 for bearish and 0 for cyclic regime.
🌸 --------- FINAL NOTES --------- 🌸
💮 Development Philosophy
The Market Regime Detector has been developed with several key principles in mind:
1. Robustness - The detection methods have been rigorously tested across diverse markets and timeframes to ensure reliable performance.
2. Adaptability - The detector automatically adjusts to changing market conditions, requiring minimal manual intervention.
3. Complementarity - Each detection method provides a unique perspective, with the collective consensus being more reliable than any individual method.
4. Intuitiveness - Complex technical parameters have been abstracted into easily understood controls.
💮 Ongoing Refinement
The Market Regime Detector is under continuous development. We regularly:
• Fine-tune parameters based on expanded market data using state-of-the-art Machine Learning techniques
• Research and integrate new detection methodologies
• Optimise computational efficiency for real-time analysis
Your feedback and suggestions are very important in this ongoing refinement process!
Trenddetector

Bottom Up - Slope Trend DetectorSlope Trend Detector by Bottom Up
This indicator is a simple slope trend detector which highlights clearly current market bias.
It uses an EWMA to get a smoother moving average on which to identify the trend by monitoring the slope. EWMA reduces noise and gives a more reliable trend reading.
It isn't subject to repaint and sends an alert whenever the trend changes.
It shows two moving averages simultaneously, a faster one and a slower one, whose periods can be customized by the user, to have a clear reading of the current market condition, allowing to distinguish retracements from long-term structural changes.
Add to chart. Turn on alerts. Happy trading!
Bottom Up - The Ecosystem Designed for Traders
bottomup.finance

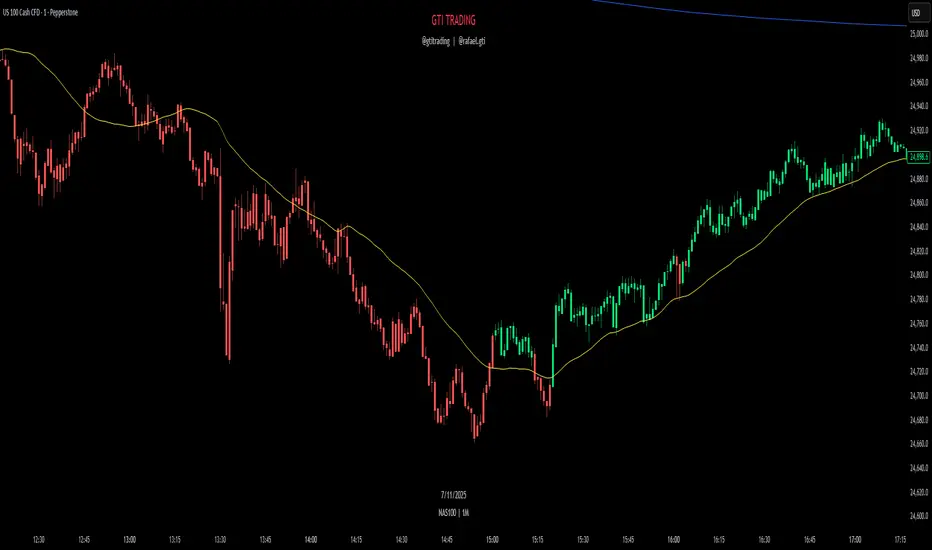
GTI TrendThe GTI Trend is a trend-detection indicator that highlights potential market direction by coloring candles based on internal analysis of higher timeframe momentum and price action behavior.
Unlike simple moving average crossovers or RSI thresholds, GTI Trend uses a proprietary blend of price positioning logic and multi-timeframe validation. Specifically, it evaluates candle structures and key breakout zones from larger timeframes to determine whether short-term movements align with higher timeframe momentum — helping traders avoid false breakouts and identify real trend continuation zones.
The result is a real-time visual cue: green candles for bullish bias and red candles for bearish bias — tuned for lower timeframes like 1m, 3m, and 5m. This helps scalpers and short-term traders align entries with broader market structure.
How It Works
GTI Trend is built around the concept of directional alignment. It compares short-term price action against higher timeframe swing zones and dynamic reference levels. When price confirms breakout behavior while staying within those zones, the candle turns green or red accordingly. This avoids the lag often seen in classic indicators.
The system dynamically adapts to market volatility, making it particularly effective in fast-moving sessions like the New York Open (typically from 10:30 AM GMT -3).
Confluence Strategy
The GTI Trend is most effective when combined with a 38-period short-term moving average. If the candle is green and the price is above the MA, this confirms a bullish continuation. Conversely, a red candle below the MA may suggest a bearish reversal.
Pairing it with VWAP is also recommended, especially in index markets, as this highlights possible support/resistance zones to validate the signal.
Recommended Markets
The GTI Trend performs best on high-volatility assets such as NASDAQ, US30, SP500, Gold (XAUUSD), and the Brazilian mini index. However, it can be applied to any asset with sufficient price movement.
NOVA Breakout Signals & Trend Detector v2.3 (TF M30)NOVA Breakout Signals & Trend Detector (TF M30)
Lightweight indicator that combines my breakout entries with a trend filter. It plots clean LONG/SHORT labels only (no orders, SL/TP) and can shade background by trend. Signals are de-duplicated with a cooldown and are raised on confirmed bars only. Optional alerts are included.
Features
• Breakout entries from recent structure, filtered by overall trend.
• Minimal, clutter-free labels at the bar of entry.
• Optional trend label/background & alert conditions.
• Default timeframe M30; logic is optimized for this TF.
Notes
• Indicator only (no automatic trades).
• Use alerts to route signals to your preferred workflow.
• For research/education; past performance ≠ future results.
Made by Kenny Nguyen from Vietnam!

Market Breadth Peaks & Troughs IndicatorIndicator Overview
Market Breadth (S5TH) visualizes extremes of market strength and weakness by overlaying -
a 200-period EMA (long-term trend)
a 5-period EMA (short-term trend, user-adjustable)
on the percentage of S&P 500 constituents trading above their 200-day SMA (INDEX:S5TH).
Peaks (▼) and troughs (▲) are detected with prominence filters so you can quickly spot overbought and oversold conditions.
⸻
1. Core Logic
Component Description
Breadth series INDEX:S5TH — % of S&P 500 stocks above their 200-SMA
Long EMA 200-EMA to capture the primary trend
Short EMA 5-EMA (default, editable) for short-term swings
Peak detection ta.pivothigh + prominence ⇒ major peaks marked with red ▼
Trough detection (200 EMA) ta.pivotlow + prominence + value < longTroughLvl ⇒ blue ▲
Trough detection (5 EMA) ta.pivotlow + prominence + value < shortTroughLvl ⇒ green ▲
Background shading Pink when 200 EMA slope is down and 5 EMA sits below 200 EMA
⸻
2. Adjustable Parameters (input())
Group Variable Default Purpose
Symbol breadthSym INDEX:S5TH Breadth index
Long EMA longLen 200 Period of long EMA
Short EMA shortLen 5 Period of short EMA
Pivot width (long) pivotLen 20 Bars left/right for 200-EMA peaks/troughs
Pivot width (short) pivotLenS 10 Bars for 5-EMA troughs
Prominence (long) promThresh 0.5 %-pt Depth filter for 200-EMA pivots
Prominence (short) promThreshS 3.0 %-pt Depth filter for 5-EMA pivots
Trough level (long) longTroughLvl 50 % Max value to accept a 200-EMA trough
Trough level (short) shortTroughLvl 30 % Max value to accept a 5-EMA trough
⸻
3. Signal Guide
Marker / Color Meaning Typical reading
Red ▼ Major breadth peak Overbought / possible top
Blue ▲ Deep 200-EMA trough End of mid-term correction
Green ▲ Shallow 5-EMA trough (early) Short-term rebound setup
Pink background Long-term down-trend and short-term weak Risk-off phase
⸻
4. Typical Use Cases
1. Counter-trend timing
• Fade greed: trim longs on red ▼
• Buy fear: scale in on green ▲; add on blue ▲
2. Trend filter
• Avoid new longs while the background is pink; wait for a trough & recovery.
3. Risk management
• Reduce exposure when peaks appear, reload partial size on confirmed troughs.
⸻
5. Notes & Tips
• INDEX:S5TH is sourced from TradingView and may be back-adjusted when index membership changes.
• Fine-tune pivotLen, promThresh, and level thresholds to match current volatility before relying on alerts or automated rules.
• Slope thresholds (±0.10 %-pt) that trigger background shading can also be customized for different market regimes.

TechniTrend: Strong Candles DetectorTechniTrend: Strong Candles Detector
Description:
The TechniTrend: Strong Candles Detector indicator is designed to identify strong candlestick patterns based on customizable thresholds of candle strength, volume, and price volatility. By detecting significant candles that have a high proportion of body relative to total range, the indicator helps traders identify potential shifts in market direction, making it a useful tool for trend analysis and reversal spotting.
Key Features:
Candle Strength Detection: The indicator calculates the strength of a candle based on the ratio of its body (difference between open and close) to its total range (high minus low). If the body size exceeds a user-defined threshold, the candle is flagged as strong. This helps traders quickly identify key candles that may signal market movements.
Volume Confirmation (Optional): An optional volume confirmation allows the indicator to only flag candles as "strong" if the trading volume during the candle exceeds the average volume over a customizable period. This can help validate that a candle’s movement is backed by significant market participation.
Volatility Body Confirmation (Optional): Users can further refine the detection by requiring that the body of a strong candle exceed the average body size (volatility) of previous candles. This ensures that candles with greater price movement are prioritized.
Customizable Inputs:
Strength Threshold: Defines the minimum ratio of body to total range for a candle to be considered strong.
Moving Average Type: Choose from SMA, EMA, or WMA for calculating the moving average of volume or body volatility.
Volume and Body Confirmation: Adjust the percentage thresholds for the difference between the current volume/body size and their average values.
Visual Alerts: The indicator marks strong bullish candles with green upward labels below the candle, and strong bearish candles with red downward labels above the candle. Additionally, strong candles can be highlighted with a customizable background color for easier visualization.
How It Works:
Strength Ratio:
The core of this indicator is the calculation of the strength ratio, which is defined as the body size (open-close) divided by the total range (high-low). If the body size is larger relative to the total range and exceeds the user-defined threshold, the candle is flagged as strong.
Volume and Volatility Confirmation:
For traders seeking additional confirmation, the indicator can be configured to only mark candles if the current volume or body volatility exceeds the average by a user-defined percentage. These confirmations can be toggled on or off to suit different trading strategies.
Customization Options:
Strength Threshold (0-1):
Sets the minimum strength required for a candle to be flagged. A higher value will result in fewer but more significant candles being marked.
Volume Confirmation:
Toggle on to require a higher volume compared to the average volume for a candle to be confirmed as strong.
Volatility Body Confirmation:
Toggle on to require a larger candle body compared to the average body size for further confirmation.
Candle Color:
Choose the background color used to highlight strong candles.
Recommended Settings:
Strength Threshold: 0.7 (for a good balance between body and range)
Volume Difference: 0.05 (5% above the average volume)
Body Volatility Difference: 0.05 (5% above the average body size)
Length: 14 (for volume and volatility moving averages)
Conclusion: The TechniTrend: Strong Candles Detector is an easy-to-use yet powerful tool for traders who want to identify key candles that signal potential market trends. Its customizable settings allow for fine-tuning to fit different trading styles, whether looking for high-volume breakouts or significant price movements. The indicator offers both a visual and configurable alert system to help traders make more informed decisions.

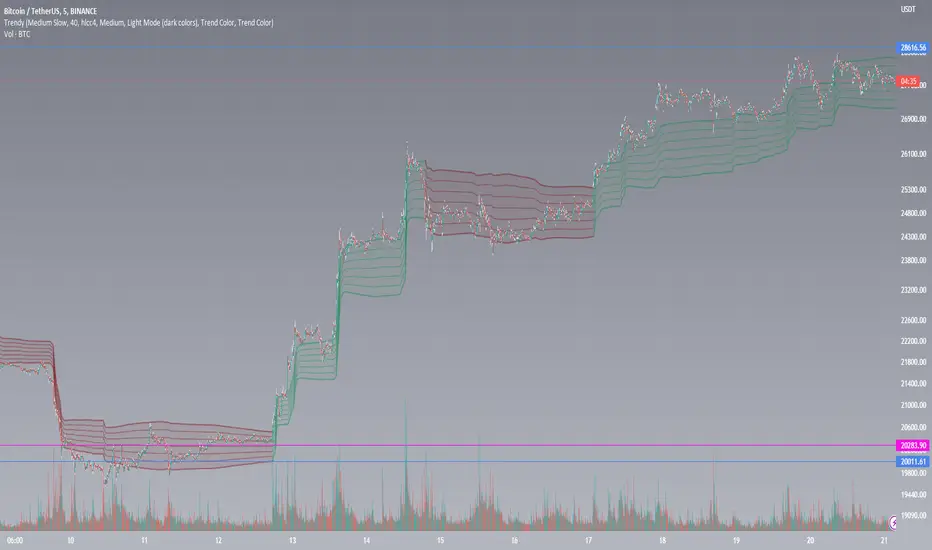
Trendgetter: Trend Detection, Regime Change, Bias Filter by [CR]Trendgetter: Trend Detection, Regime Change, Bias Filter by Cryptorhythms
“If you are not a trend setter, at least be able to exploit the ones you see.”
― Jeffrey Fry
Intro
Cryptorhythms back again with a members only indicator for trend capture this time! Trendgetter is not crypto specific and can be applied to a variety of timeframes, markets, and tickers. Its meant to be a general purpose trading aid and bias filter, providing reliable trend, bias and regime change information.
Introduction
This indicator relies upon various methods related to probabilities/statistics, digital signal processing and data science to predict optimal fair local price given any financial time series data. The goal was to create a tool that isolates trends and captures their bias, making it easier to follow a noisy market. The focus is making high hit rate uncorrelated returns to your base market. The way in which this indicator is constructed is not based upon any previous public work, and was researched and refined over a period of 6 months of trading and testing based on my own personal trading experiences and observations of the market. I use novel techniques I developed in house to denoise the data and determine a local fair price.
Description
The parameters in this indicator are mostly fixed and do not lend themselves to overfitting. So when you find good settings, its probably legit and not a false positive. They were pre-determined based on my own testing and research to handle almost all possible combinations of price action for determining trends. By fixing some parameters, you automatically reduce the chances of overfitting to historical data. The pre determined levels were carefully chosen after many options were considered.
Not just a bias filtooor, fair price predictooor and regime change detectoooor though! TG also provides a price envelope feature which shows a likely fair price range that price will distribute itself upon. Above or below the envelope indicates the presence of a very strong trend . Within the envelope indicates consolidation , but still conforming to the bias. TG then uses a statistics-based approach to display a likely range that price could potentially travel over the near term which we called a price envelope.
An additional option provides background coloration when there is the potential for a regime change on the trend bias. This can be used as a feature to help you manage your trades risk. This is simply measured by an internal (non exposed) script value returning to a mean which triggers the color to appear.
Further Explanation of Settings
-Timeframe : Change the timeframe the indicator is calculated on allowing you to for instance use the 15m Trendgetter output while remaining on the 5 minute chart.
-Trend Capture : This is the "type" of trend you are trying to follow. The different options will attempt to find the trends at various levels of noise cancellation within the lookback period you specify. "Reactive" means it will quickly change its bias and capture smaller trends. "Slow" means it will filter more noise and capture larger trends. "Adaptive" is completely in its own class of behavior and was my attempt to mix both a slow and reactive profile into one setting, it uses a few market metrics like volume and volatility to adjust parameters on the fly.
-Sample Length : Bars to consider in the calculation. Using large numbers here is not going to help, but rather hurt your results. Generally 10-100 is the range you should use for the best results. The exact value will depend on the timeframe, volatility and market/asset you are trading, and you should experiment to find it. (There is no "one size fits all" for potential trading situations)
-Source : Data series used for calculation. I recommend hlcc4 or hl2 or hlc3 instead of just "close." This will help to pre process a noisy data series for the rest of the algo.
-Certainty Level : This setting effects how easily the indicator will confirm a new trend and change its bias. " Reactive" does just as it says and will confirm new regimes faster, but can also lead to false signals or "flip flop" in certain types of price action. "Slow" will change biases less frequently or in conjunction with large moves - but this level of certainty requires the sacrifice of reactivity meaning its a bit laggy (but thats ok when you are following a larger trend). "Medium" is as you would expect the middle ground between reactive and slow. Lastly "Adaptive" tends to fall between reactive and medium in its behavior typically, but it will somewhat adjust itself to suit the variability of market conditions.
-Price Envelope :
-----My own personally created price distribution spread (not monte carlo based)
-----Above or below the envelope indicates the presence of a very strong trend. You should not be fading a trend when its in this position!
-----Within the envelope indicates consolidation, but still conforming to the bias.
User Requests :
Of course we also listen to the needs of our members and added these features upon request.
-Added dark mode and light mode themes.
----Dark Mode is for dark/black charts and uses lighter colorations
----Light mode is for light/white charts and uses darker colorations
-More updates to display and color selection options such as background colors and fill colors.
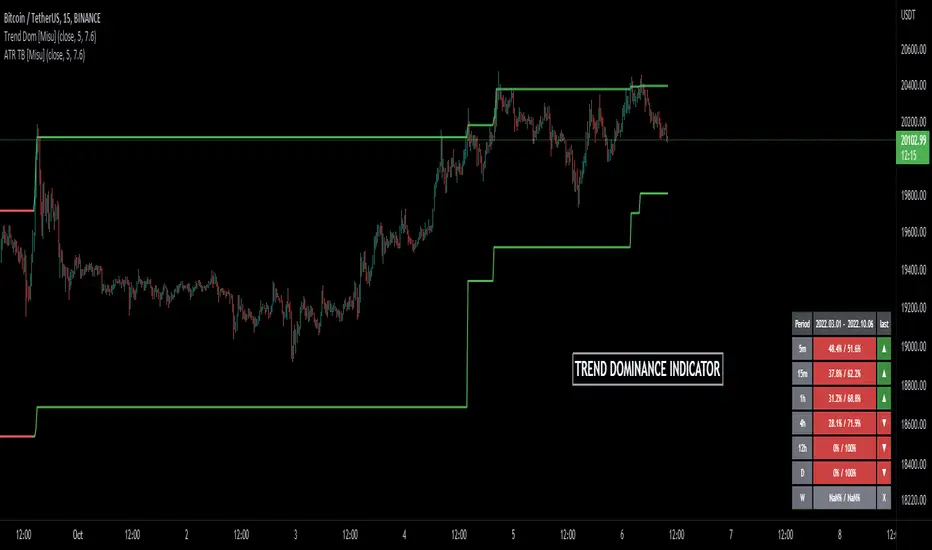
Trend Dominance Multi Timeframe [Misu]█ This indicator shows the repartition of bullish and bearish trends over a certain period in multiple timeframes. It's also showing the trending direction at the time.
█ Usages:
Trend dominance is expressed with two percentages: left is downtrend and right is uptrend. Cell colors turn green if dominance is up and red if it is down.
Knowing the trend dominance allows you to have a better overview of the market conditions.
You can use it to your advantage to favor long or short trades, reversal or breakout strategies, etc.
█ Features:
> Table colors
> Instant Trend Multitimeframe
> Trend Dominance Multitimeframe
█ Parameters:
> Length: Length is used to calculate ATR.
> Atr Multiplier: A factor used to balance the impact of the ATR on the Trend Bands calculation.
> UI Settings
Zigzag Trend/Divergence DetectorPullbacks are always hardest part of the trade and when it happen, we struggle to make decision on whether to continue the trade and wait for recovery or cut losses. Similarly, when an instrument is trending well, it is often difficult decision to make if we want to take some profit off the table. This indicator is aimed to make these decisions easier by providing a combined opinion of sentiment based on trend and possible divergence.
⬜ Process
▶ Use any indicator to find trend bias. Here we are using simple supertrend
▶ Use any oscillator. I have added few inbuilt oscillators as option. Default used is RSI.
▶ Find divergence by using zigzag to detect pivot high/low of price and observing indicator movement difference between subsequent pivots in the same direction.
▶ Combine divregence type, divergence bias and trend bias to derive overall sentiment.
Complete details of all the possible combinations are present here along with table legend
⬜Chart Legend
C - Continuation
D - Divergence
H - Hidden Divergence
I - Indeterminate
⬜ Settings
▶ Zigzag parameters : These let you chose zigzag properties. If you check "Use confirmed pivots", then unconfirmed pivot will be ignored in the table and in the chart
▶ Oscillator parameters : Lets you select different oscillators and settings. Available oscillators involve
CCI - Commodity Channel Index
CMO - Chande Momentum Oscillator
COG - Center Of Gravity
DMI - Directional Movement Index (Only ADX is used here)
MACD - Moving average convergence divergence (Can chose either histogram or MACD line)
MFI - Money Flow Index
MOM - Momentum oscillator
ROC - Rate Of Change
RSI - Relative Strength Index
TSI - Total Strength Index
WPR - William Percent R
BB - Bollinger Percent B
KC - Keltner Channel Percent K
DC - Donchian Channel Percent D
ADC - Adoptive Donchian Channel Percent D ( Adoptive-Donchian-Channel )
▶ Trend bias : Supertrend is used for trend bias. Coloring option color candles in the direction of supertrend. More option for trend bias can be added in future.
▶ Stats : Enables you to display history in tabular format.
Overview of settings present here:
⬜ Notes
Trend detection is done only with respect to previous pivot in the same direction. Hence, if chart has too many zigzags in short period, try increasing the zigzag length or chart timeframe. Similarly, if there is a steep trend, use lower timeframe charts to dig further.
Oscillators does not always make pivots at same bar as price. Due to this some the divergence calculation may not be correct. Hence visual inspection is always recommended.
⬜ Possible future enhancements
More options for trend bias
Enhance divergence calculation. Possible options include using oscillator based zigzag as primary or using close prices based zigzag instead of high/low.
Multi level zigzag option - Can be messy to include more than one zigzag. Option can be added to chose either Level1 or Level2 zigzags.
Alerts - Alerts can only be added for confirmed pivots - otherwise it will generate too many unwanted alerts. Will think about it :)
If I get time, I will try to make a video.

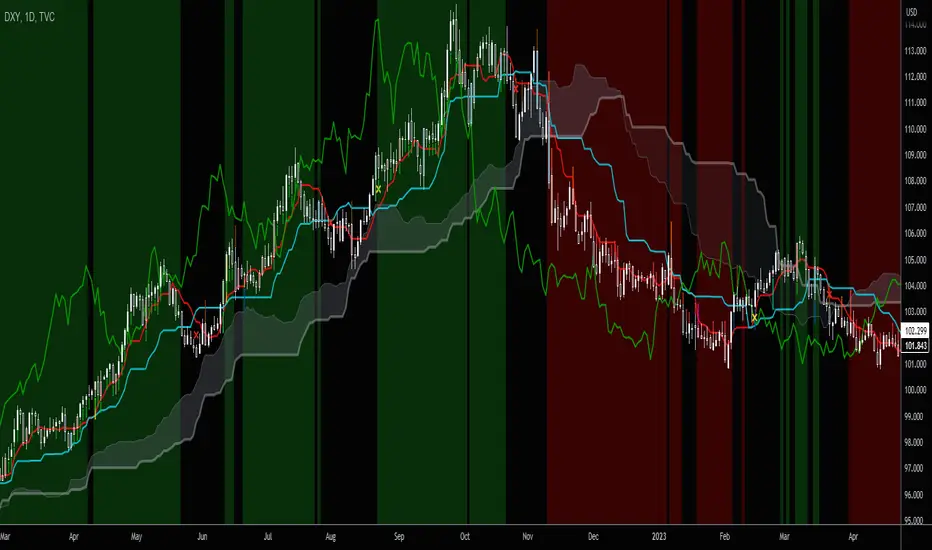
Ichimoku Trend DirectionThis script will help you detect the current trend of market use Ichimoku trading system. We use the default parameters.
To reduce risk, ONLY trade follow the trend of high time frame!
Very simple to use:
- Green background when market Up trend
- Red background when market Down trend
Have a nice trade! :P
[blackcat] L2 Ehlers Early Onset TrendLevel: 2
Background
John F. Ehlers introuced Early Onset Trend Indicator in Aug, 2014.
Function
In “The Quotient Transform” in Aug, 2014, John Ehlers described an early trend detection method, the idea of the quotient transform, that was designed to reduce the lag often found in other trend indicators. I provided a script with pine v4 code here for the early-onset trend-detection indicator and also describes an approach for creating a strategy based on this indicator as an example.
The entry points displayed in blue on the price chart are defined by the top Onset Trend Detector upper quotient crossing above a threshold value e.g zero or 0.25/-0.25 here in this script. In the article, Ehlers suggested using a different K value for the exit, so the exit points are determined by the lower Onset Trend Detector quotient crossing below a threshold e.g. zero or -0.25/0.25 here in this script.
Key Signal
Quotient1 --> upper quotient in yellow which determines long entry
Quotient2 --> lower quotient in fuchsia which determines short entry
long ---> long entry signal
short ---> short entry signal
Pros and Cons
100% John F. Ehlers definition translation, even variable names are the same. This help readers who would like to use pine to read his book.
Remarks
The 82th script for Blackcat1402 John F. Ehlers Week publication.
Readme
In real life, I am a prolific inventor. I have successfully applied for more than 60 international and regional patents in the past 12 years. But in the past two years or so, I have tried to transfer my creativity to the development of trading strategies. Tradingview is the ideal platform for me. I am selecting and contributing some of the hundreds of scripts to publish in Tradingview community. Welcome everyone to interact with me to discuss these interesting pine scripts.
The scripts posted are categorized into 5 levels according to my efforts or manhours put into these works.
Level 1 : interesting script snippets or distinctive improvement from classic indicators or strategy. Level 1 scripts can usually appear in more complex indicators as a function module or element.
Level 2 : composite indicator/strategy. By selecting or combining several independent or dependent functions or sub indicators in proper way, the composite script exhibits a resonance phenomenon which can filter out noise or fake trading signal to enhance trading confidence level.
Level 3 : comprehensive indicator/strategy. They are simple trading systems based on my strategies. They are commonly containing several or all of entry signal, close signal, stop loss, take profit, re-entry, risk management, and position sizing techniques. Even some interesting fundamental and mass psychological aspects are incorporated.
Level 4 : script snippets or functions that do not disclose source code. Interesting element that can reveal market laws and work as raw material for indicators and strategies. If you find Level 1~2 scripts are helpful, Level 4 is a private version that took me far more efforts to develop.
Level 5 : indicator/strategy that do not disclose source code. private version of Level 3 script with my accumulated script processing skills or a large number of custom functions. I had a private function library built in past two years. Level 5 scripts use many of them to achieve private trading strategy.
ATR Auto Oscillator [DepthHouse]The ATR Auto Oscillator uses advanced range calculations to determine a dynamic range that the applied market moves within. Like an RSI , the ATR Auto Oscillator measures the speed and change of price movements through a given range. Unlike an RSI , the ATR Auto Oscillator automatically re-configures range values dependent on the user set lookback.
The oscillator ranges between (0.1) and 1.1. Generally, the market is oversold while the bands are below 0.2 and is overbought while above 0.8.
The two bands displayed are used to determine short term trend directions and the oversold/undersold state of the applied market. Crossovers of these bands could give a hint to the direction the market is moving.
The fast band (green) is the direct value of where the market is within its calculated range; 1.1 representing the top of range, and -0.1 representing the bottom. Even when this value is near the bottom of the top of the range, the auto oscillator will readjust to create a new range that the market travels within.
The slow band (red) is a lagging version of the fast band which is used to determine the oversold/overbought signals. When this band travels within the oversold and overbought regions the background color will change to signal a warning. If the fast band crosses the slow band within these zones, an opaque signal will appear. These signals are used to catch possible trend reversals.
Breakout Signals ( BETA ):
Breakout signals are the up and down arrows displayed on the top and bottom of the oscillator. A refined range is generated by the user set 'High Low Length'; it is then displayed by the light gray horizontal lines. If the user set band (fast or slow) returns into the range within a given period (breakout offset) then a signal will generate.
Built in Alerts (must be set up by user):
Bullish & Bearish Crossovers within the oversold and overbought ranges.
Bullish & Bearish Breakout alerts (beta)
Users can also set custom alerts. Example: Fast Band crossing up Value: 0.7
To gain access to this indicator please follow the link below.
Feel free to message me with any questions directly here on TradingView.

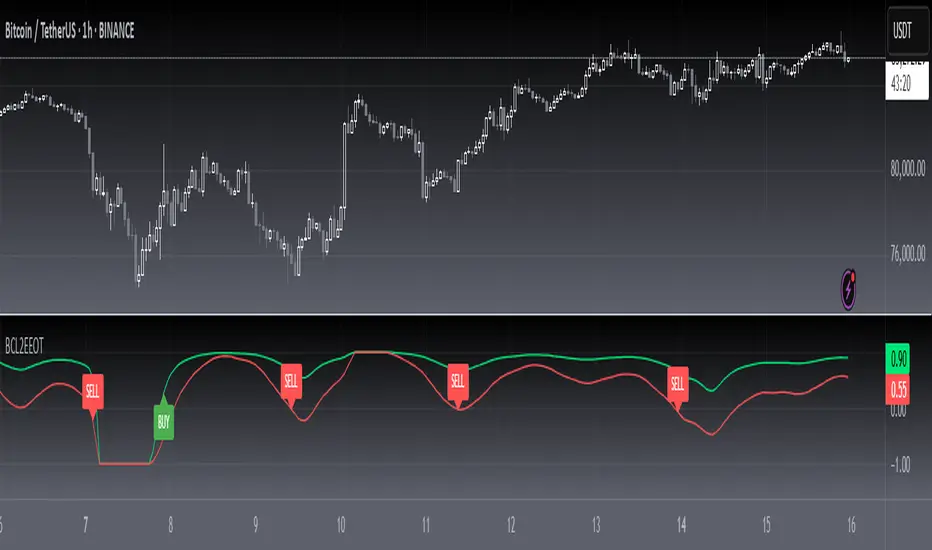
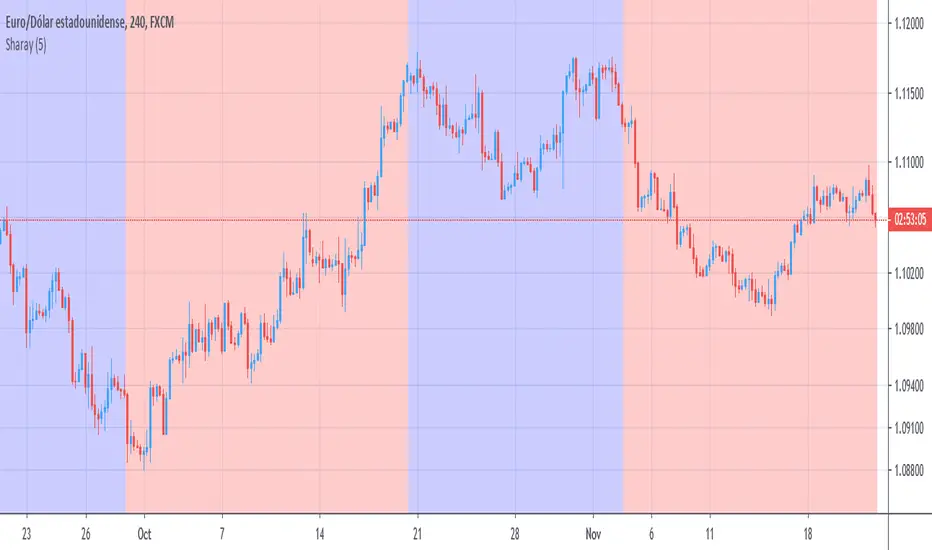
SharaySharay indicator
The Sharay indicator is a trading tool based on the analysis of consecutive candles. The signals to generate alerts can also be a sign of support and resistance.
The indicator has the visualization of the classic bluesky indicator and it can clearly identify the direction of a trend or market momentum.
The signals produced help traders find the most optimal entry and exit points for their operations.
Configurations
The length of consecutive candles in a range of 2 to 5
Show the previous origin of a signal in the form of support
Show parabolic SAR
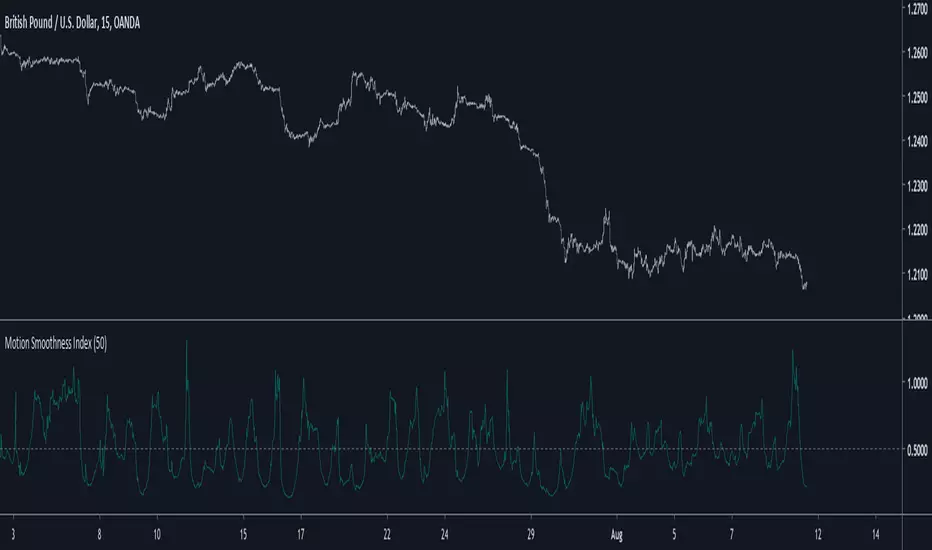
Motion Smoothness Index Introduction
Its holiday time for me, i have been working here a lot. But no leaving before publishing. Telling when market price is smooth or rough is not the easiest task, so today i present a trend metric indicator that allow you to give you this kind of information.
The Indicator
The indicator is in an approximate range of (0,1) with mean x̄ decaying for higher length's, when the indicator is below 0.5 the market is smooth, else rough, this is the simple interpretation. The indicator is simply the ratio of the price residual standard deviation and the price standard deviation.
Higher value of length will make the indicator less accurate when it comes to detect rough market price, you can still use the indicator direction or its running mean to give you insights but 0.5 is still the recommended detection threshold.
In More Depth
Even tho market is random by nature there can still be structures in the price (cycles and trends), the fractional BM model will tell you that market price is sometimes auto-correlated (trending) or non auto-correlated (ranging), knowing what is the current market state is therefore important, when price is rough it can means an excess in noise thus exhibiting an uncorrelated market at the contrary of a smoother price that can allow for auto-correlation.
Now, market is infected by noise, and thats really unfortunate but the noise posses various properties that can allow for all the structures we see in market price. So thinking about the market allowing for possible profits during auto-correlated states is encouraging.
Conclusion
Although the indicator measure smoothness/roughness it can still be interpreted as a trend/range state detector. I hope it provide to be useful.
I wish you all good holidays and see you next time ! Thanks for reading !
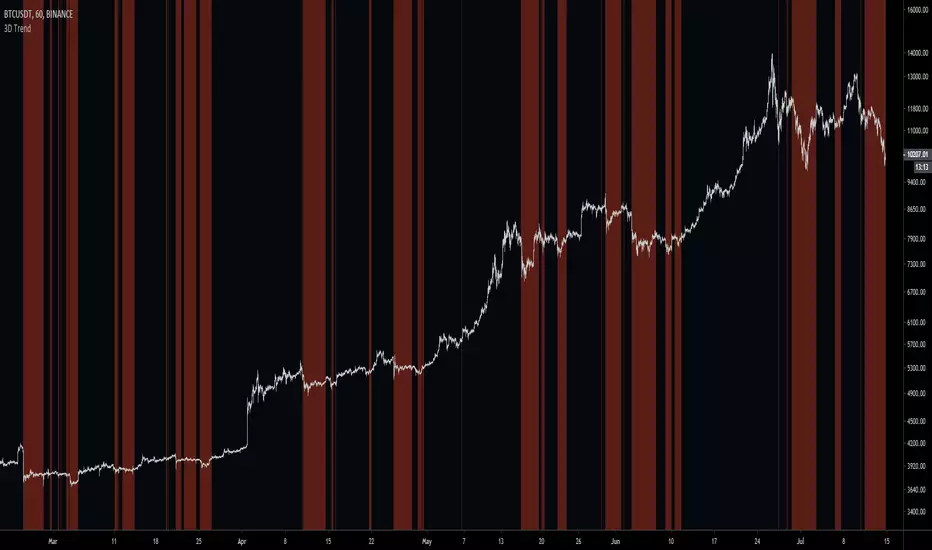
3D Trend Identification [MaliciousUpload]The trend is your friend. :)
Comparison of the previous 3 day's data.
This is used for directional confirmation of trend.
Not a "BUY/SELL NOW 100x NO SL" type of indicator.
Dark Blue = Long opportunity
Orange = Short opportunity
Hit me up on Discord, always looking for experienced traders to chat with
MaliciousUpload#1637
The source code of this study is protected. Everyone can add it to favorites and use it, but only you can see the source code of this script.
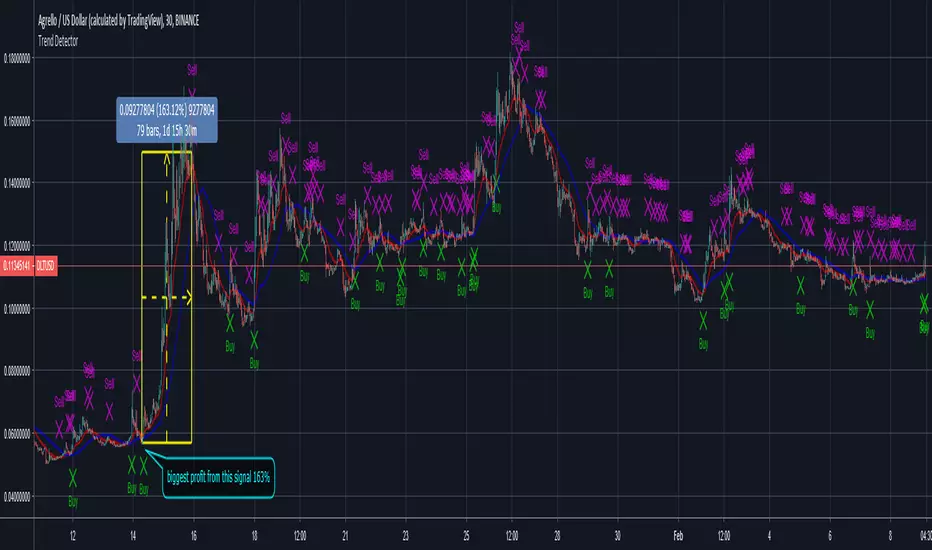
Trend Detector
New indicator for today called Trend Detector, follows the trend. It shows buy signals when coin is going up, sell signals when it is going down. Indicator showed plenty of Buy and Sell signals at the right times for buying and selling DLT . This indicator works on real time so you get the alerts on time so you can action it. Works on other cypto and stocks.
5e_TrendDetector_v1.00/7just another version of the tradingroomapp 100/7 ema crossover.
i thought id build this one off the main overlay in its own box below.
as you can see here with gvt it confirmed the major correction was over and is now in another one following a decent run to 0026.
a cross and close above would signal the next wave is in play.
credit to chris moody for the coding

Peso Pros Trend DetectorThis indicator will help you predict market moves, reversals, entries and exits.
When green line is above red line, there are more bulls than bears present and this is an indication of the current trend on your timeframe. When the lines cross, you can start looking for an exit to a trade or an entry for the opposite direction based on your price action and strategy.
When there is a difference between the bulls and bears of more than 15% then a vertical line will print on the indicator showing the dominant power (either bulls or bears) during the period. When the two lines are moving away from each other then the trend is moving in favor of the dominant power (the one on top).
The top level indicates the stronger force. The lower level is the weaker force. Once you see a cross you can take a trade in the dominant direction if bulls and bears are moving away from each other (further apart in the power struggle). So if you are looking to short the Peso for example and you see a trend line break and a level break + the bulls are getting weaker in the indicator while the bears are getting stronger (price moving away from each other) then you have extra confirmation for a sell trade. As the bulls and bears difference in power shrinks and the green and red lines come closer together you can confirm an exit entry and wait for another entry after a pullback.
Login to your Peso Pros member account to watch the instructional video for more information and a deeper understanding of this indicator.
