Indicadores, estrategias y bibliotecas
Summary : Market price is simply a dance of liquidity to the specific market. tl;dr: "Cash come-in, market moon; Cash go-out, market doom" In Simple Language : Large changes in the money flow to an asset often mark local price extremia. Academic paper: Title: Z-Score(Slope(OBV)): An Efficient Indicator for Identifying Local Extremes in Asset Prices...
This script boxes a custom session and sets the box at the high and low of the session and draws that box to the next session. Box color is determined by price in relation to the box position. Box color is set at the start of the next session. This allows user to lookback at multiple box sets to see how each day closed in relation to the session highlighted. I...
Greetings, I imagine there is already some similar scripts as this one but I couldn't find one so I decided to add something. We are looking at convergence and divergence signals of moving-average values of 3 different volume time frames. The time frames can of course be tweaked to ones liking, I set up Vol-MA8, 20 and 50. A strong enough divergence in at least...
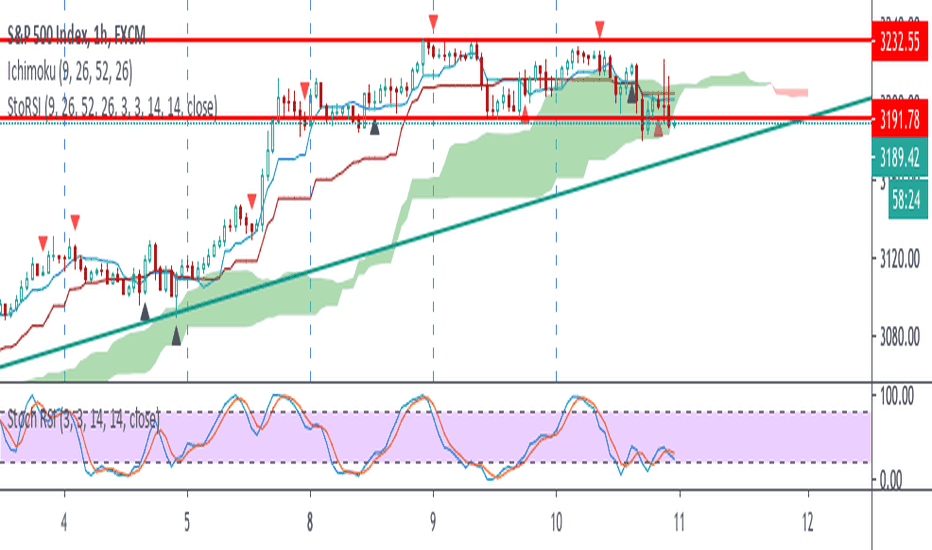
This script uses 25-75 treshold of stochastic RSI with the help of kijun-sen as confirmation, to find entry points to any trend either newly developed or an established one. I just realized it on the 1 hour SPX chart. Sure it can be used on other symbols. Crossing above/below 25/75 line of sto RSI is considered as buy/sell signal. Signals are evaluated whether...
Kalman filter on multiple RSI periods. Usefull on higher timeframes to confirm a change of trend.
This is a combination of a slightly sped up MACD overlay on top of a modified Bar Trend Squeeze or highly modified Momentum indicator. Helps to see the trend/momentum matched with the characteristics of the MACD and it's historiography. Very user friendly for adjusting color, transparency, depth, lines, size, etc. MACD is the dark gray line. Its signal slower...
Simple Pivot Reversal Strategy with some adding settings. Date Range: To test over specific market conditions. Initial Capitol: $10K - This is a more realistic representation of funds used this strategy (for me anyway). The default of $100K can give different results (usually better) than when using a smaller balance. Order Size: 100% Equity - These trend...
This is simple script to mark when higher high (or lower low) is made on continuously third day. There likelihood of short term reversal next day. As usual, it is just likelihood and not certainty.
SMA 200 determines the trend Bullish trend, green candles. Down trend, red candles. If the market value is narrow to the SMA200 channel, yellow candles. Setting recommended for SMA Range BTCUSD = 100 EURUSD = 1000 SPX = 100 ETHUSD = 10
"The Aroon indicator is a technical indicator that is used to identify when trends are likely to change direction. In essence, the indicator measures the time it takes for the price to reach the highest and lowest points over a given timeframe as a percentage of total time. The indicator consists of the "Aroon up" line, which measures the strength of the uptrend,...
This indicator measures the vertical distance form the current close to the MA of your choice. I find that it does not work best as an oscillator, but it works well for providing early signals for taking profits when trend continuating. For example, if you go short due to a retracement to the MA (of your choice) take profits when a bearish trendline is broken...
This is a very simple trading system which is measuring the core of uptrends and downtrends using three basic elements: Close price, HL2 price, Pivot price. Depending if the uptrend or downtrend is strong, the buy/sell signals are shown in different colors. The stronger trends are in brighter colors (lime and fuchsia). If the trend just fully changed direction...


![Trend Channel [Gu5] BTCUSD: Trend Channel [Gu5]](https://s3.tradingview.com/n/nApbXCts_mid.png)


