Double MOST with Pivot and EMAMOST Long Strategy with Multi-Filter Confirmation (Pivot + VAR Trend Filter)
This strategy combines a custom MOST stop-line structure with a moving average trend filter (EMA / VAR / ZLMA), daily pivot levels, and a 9-period VAR filter to generate clean long-only entries.
It aims to capture early trend continuations while avoiding reversals and false breakouts.
✔ Buy Conditions
A long position is opened only if all of the conditions below occur simultaneously:
MA (ort) > MOST Line (s2)
– Confirms that momentum is on the long side.
Price > Daily Pivot (pvt_gun)
– Ensures the market is trading above the day’s fair-value level.
Price > VAR(9)
– Short-term VAR filter to confirm trend strength and reduce noise.
Only the first bar where all conditions turn true generates a position.
✔ Sell Condition
A long position is closed when:
MOST Line (s2) crosses above MA (ort)
– Indicates a momentum shift against the long position.
✔ Execution Style (MetaStock-like)
Strategy operates long-only
Orders are filled on the next bar open, not on the signal bar
Commission: 0.03% (3 bps / on-binde 3)
Position size: 100% of equity per trade
This makes the behavior comparable to classical MetaStock backtesting logic.
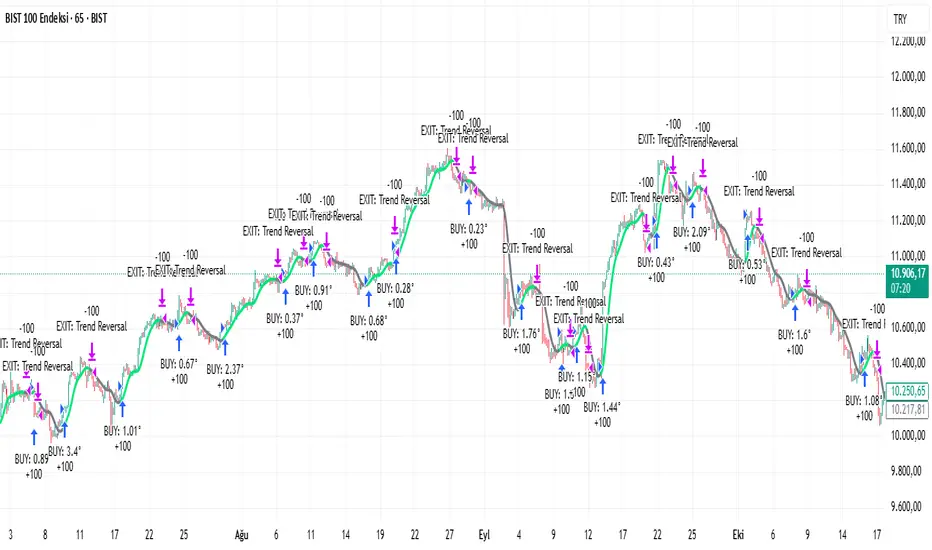
✔ Chart Markers
Only actual trade entries and exits are drawn
No repeated signals or overlapping markers
Clean visual trade history
Purpose
This strategy is ideal for traders who want:
A structured long-only trend model
A multi-layer confirmation filter
Clean execution without repaint
High-quality entries above market structure levels
Estrategia Pine Script®