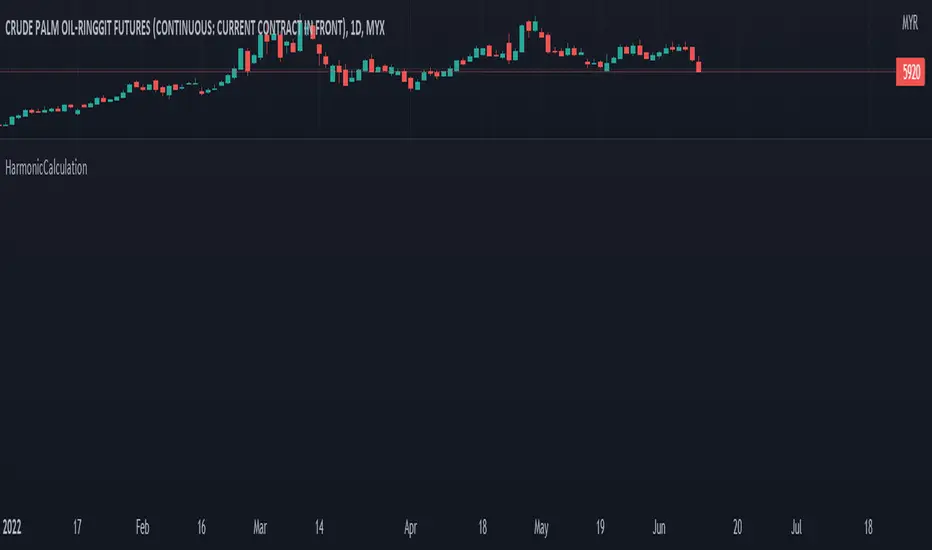
HarmonicCalculation█ OVERVIEW
This library is complementary for XABCD Harmonic Pattern Custom Range Interactive
PriceDiff()
: Price Difference
Parameters:
: : price_1, price_2
Returns: : PriceDiff
TimeDiff()
: Time Difference
Parameters:
: : time_1, time_2
Returns: : TimeDiff
ReturnIndexOf3Arrays()
: Return Index Of 3 Arrays
Parameters:
: : id1, id2, id3, _int
Returns: : ReturnIndexOf3Arrays
AbsoluteRange()
: Price Difference
Parameters:
: : price, y, point
Returns: : AbsoluteRange
PriceAverage()
: To calculate average of 2 prices
Parameters:
: : price_1, price_2
Returns: : PriceAverage
TimeAverage()
: To calculate average of 2 times
Parameters:
: : time_1, time_2
Returns: : TimeAverage
StringBool()
: To show ratio in 3 decimals format
Parameters:
: : _value, _bool, _text
Returns: : StringBool
PricePercent()
: To show Price in percent format
Parameters:
: : _price, PriceRef, str_dir
Returns: : PricePercent
BoolCurrency()
: To show syminfo.currency
Parameters:
: : _bool
Returns: : BoolCurrency
RatioText()
: To show RatioText in 3 decimals format
Parameters:
: : _value, _text
Returns: : RatioText
RangeText()
: To display RangeText in Harmonic Range Format
Parameters:
: : _id1, _id2, _int, _text
Returns: : RangeText
PriceCurrency()
: To show Currency in Price Format
Parameters:
: : _bool, _value
Returns: : PriceCurrency
TIEMPO
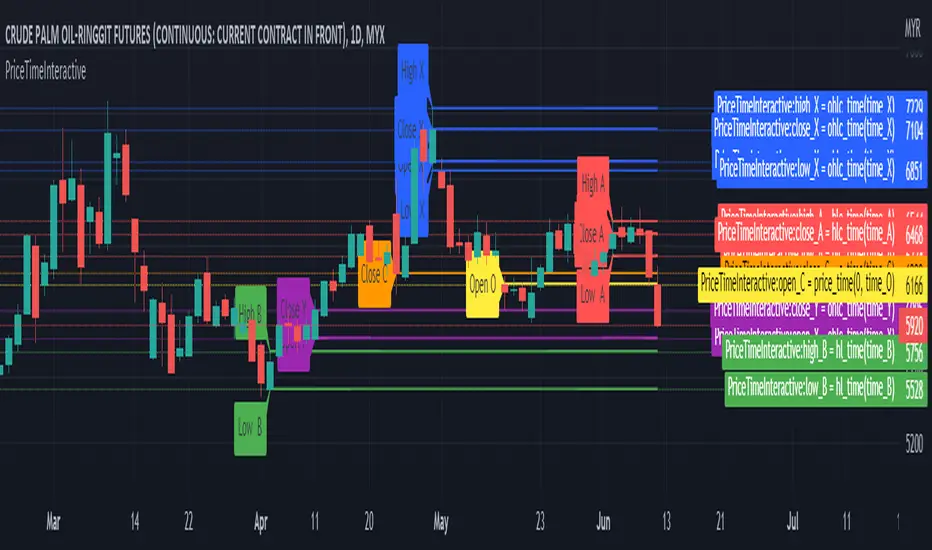
PriceTimeInteractive█ OVERVIEW
This library was intended to Get price of given time.input
█ CREDITS
Credits to TradingView for CAGR Custom Range.
█ FUNCTIONS
ohlc_time()
: Get OHLC price of given time.input
Parameters:
: : Time (t) must be using time.input
Returns: : OHLC
hlc_time()
: Get HLC price of given time.input
Parameters:
: : Time (t) must be using time.input
Returns: : HLC
hl_time()
: Get HL price of given time.input
Parameters:
: : Time (t) must be using time.input
Returns: : HL
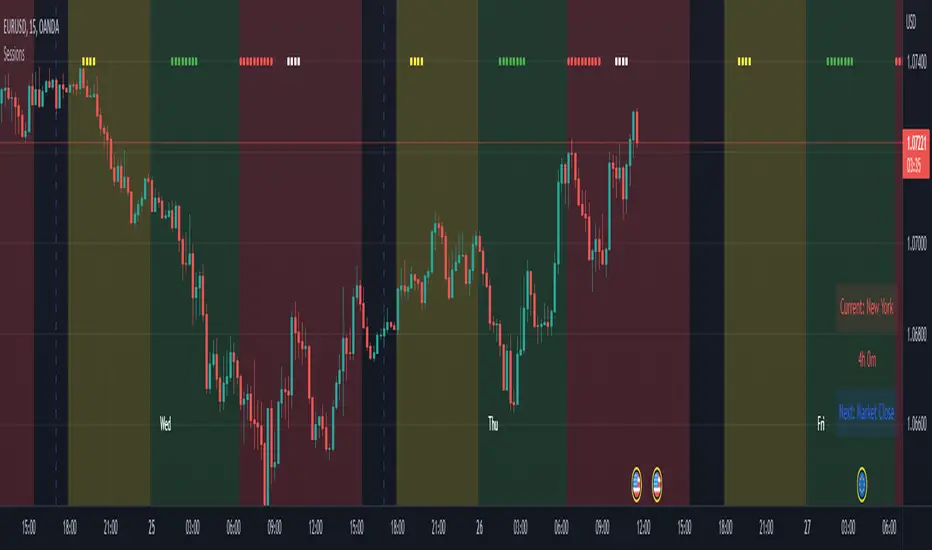
Advanced Time SessionsIntroducing a new improved Sessions indicator, still using that 24 hour look ahead plotting, this time with a twist of eye pleasing data. Now traders at a quick glance can see what session they trading in, time till its done, and what is the next session. Including daily dividers, day labels and kill zone highlighters. This tool is a day traders dream to have this subtle and stylish data at a glance letting you focus on more strategically placing your trades based around time and price!
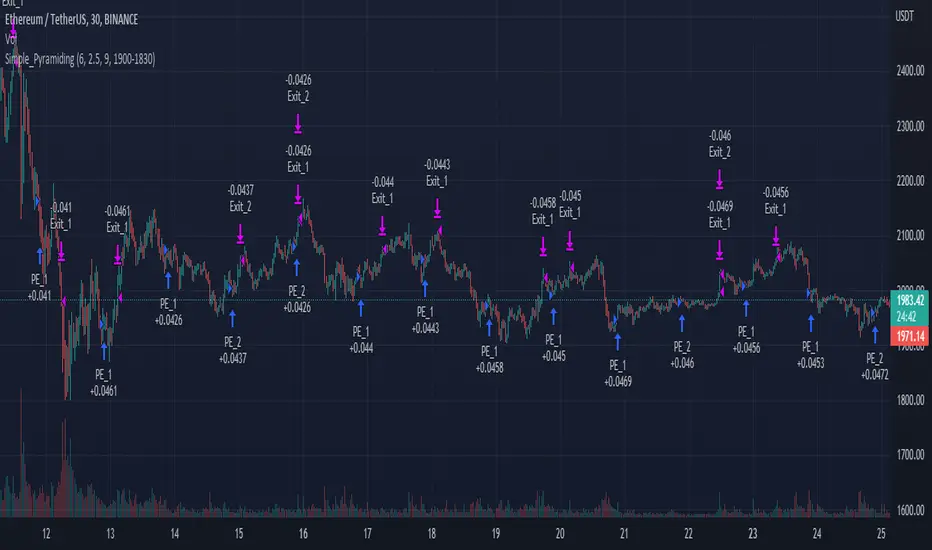
Simple_PyramidingA simple Pyramiding / DCA Strategy. Everyday at a specified time a position is opened. The individual position is closed when a take profit is triggered. Optionally a stop loss can be activated, or the option to close the position at the and of the time frame. You can specify the max amount of open positions. The equity will be divided through the max amount of open positions.
This strategy is a result of an exploration into working with time sessions, pyramiding, for loops and possibilities to trigger individual take profits (profit) and stop loss levels (stop). This strategy is by no means a worked out and reliable strategy. Please feel free to experiment with the code in your indicators and strategies.
Rangebar timeThis indicator determines the time (in minutes) for which a bar of the Range Bar type was formed.
In order to avoid errors in the calculations, a weekend check is immediately carried out (one day if it is a holiday or two days if it is a weekend).
If there are more days off, then the information on the first bar after the weekend may be incorrect.
Индикатор определяет время (в минутах), за которое образовался бар типа RangeBar.
Cразу идет проверка на выходные дни (один день, если праздник или два дня, если выходные).
Если выходных больше, то информация на 1-ом баре, после выходных может быть некорректна.

Highlight Trading Window (Simple Hours / Time of Day Filter)As the name says this is a straightforward way to highlight the times of day that you are interested in studying.
Like to trade just a market open, or highlight a full session?
Could also be used negatively to "block out" a window of time each day.
Usage:
Just set your preferred time zone and then your time window (start and end).
Hope you find it useful! 😁

Percent Off All-time High (% Off High)Percent Off All-time High tracks the percentage difference between the previous day’s closing price and the All-Time high price of the security’s entire price history.
This metric tells you how far the price has deviated from/converged on the all-time high price.

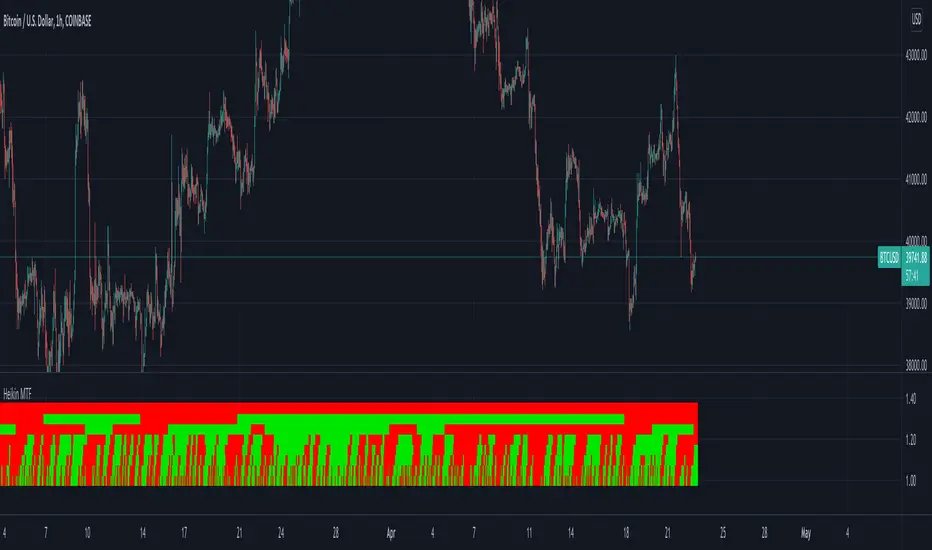
Heikin Multi Time Frame// How it Works \\
This script calculates the open and close prices of Heikin Ashi candles across multiple timeframes,
If the candle formed on that timeframe is green it will display in the table a green square, If the candle is red, the square will display red.
// Settings \\
You can change the colours of the plots
You can also Change any of the timeframes which the Heikin Ashi candles are being calculated on
// Use Case \\
Heikin Ashi candles are often used to give a smoother trend direction and help cancel out some of the noice/consolidation.
It can also be use as trend detection for multiple timeframes at once
/ / Suggestions \\
Happy for anyone to make any suggestions on changes which could improve the script,
// Terms \\
Feel free to use the script, If you do use the scrip please just tag me as I am interested to see how people are using it. Good Luck!
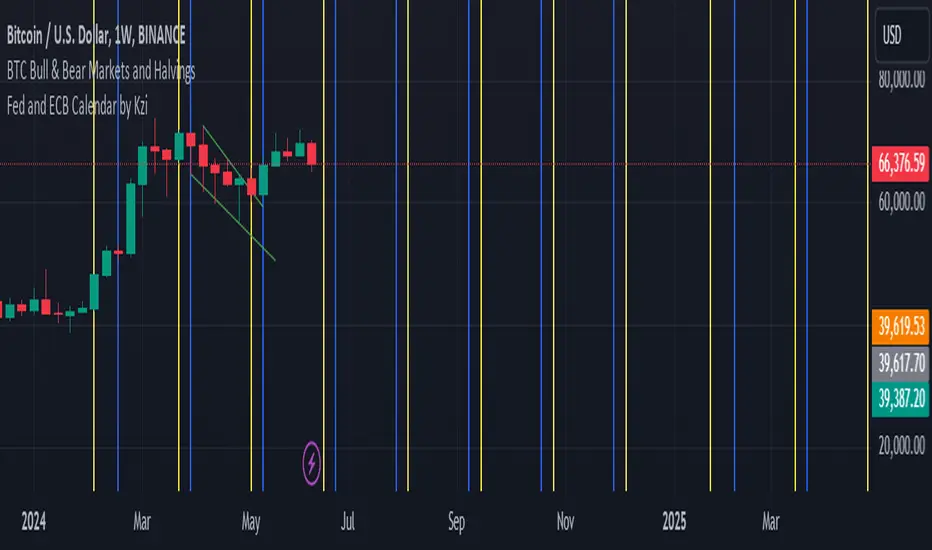
Fed and ECB Calendar by KziHello traders,
Here is a script that i've done for testing the timestamp and the input.time fonction.
You can see verticals lines blue and yellow.
The blue are the ECB meeting date (7 dates)
The yellow are the FED meeting date. (10 Dates)
// In the parameter you can enter the next rolling month date for ECB and FED
// I don't figure out how to add label / Txt on the lines
// And be carreful i don't put the real hours of the meeting.
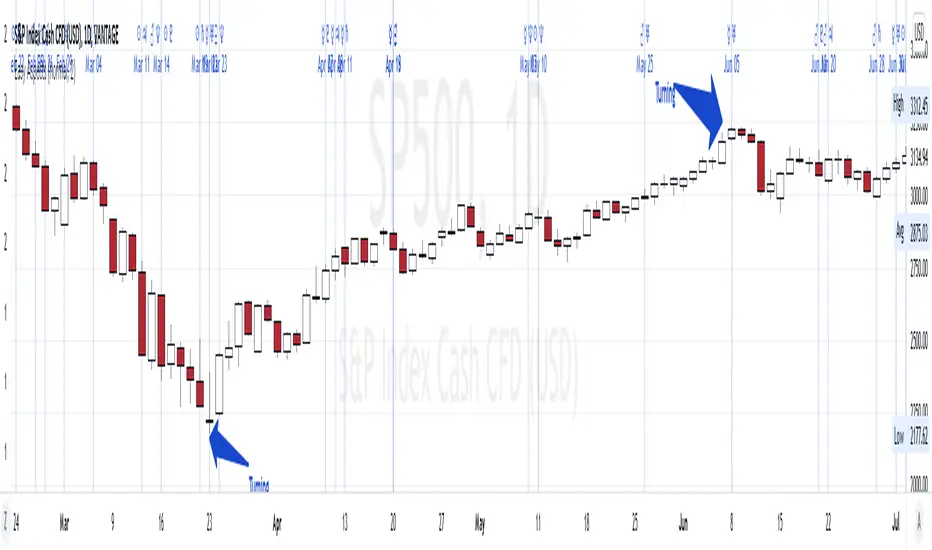
Easy AspectsHi Traders,
Planetary Aspects divided into 2 parts, Hard (Square and Opposition) & Easy (Trine and Sextile) Aspects, the Conjunction is depending on the planets.
This Easy Aspects script, contains:
1. Trine is an angle of 120°, which is 1/3 of the 360° ecliptic
2. Sextile is an angle of 60°, which is 1/6 of the 360° ecliptic or 1/2 a trine (120°)
The objectives of this script are:
1. you can see the Hard Aspects schedule in certain periods, history and future.. (you can double check it in horoscopes.astro-seek.com )
2. this script allows you see based on specific aspect view, you can observe the correlation between the hard aspects and market reaction (is it turning or is it a swinghigh/ low?
Here are some examples;
TRINE
Sextile
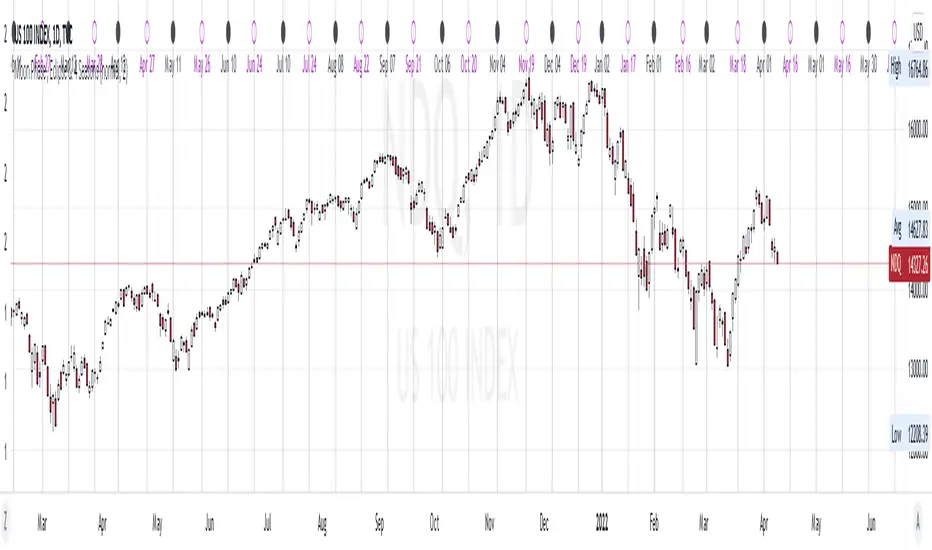
Hard Aspects Hi Traders,
Planetary Aspects divided into 2 parts, Hard (Square and Opposition) & Easy (Trine and Sextile) Aspects, the Conjunction is depending on the planets.
This Hard Aspects script, contains:
1. Square is an angle of 90°, which is 1/4 of the 360° ecliptic or 1/2 an opposition (180°)
2. Opposition is an angle of 180°, which is 1/2 of the 360° ecliptic
3. Conjunction is an angle of approximately (~) 0–10°. Typically, an orb of ~10° is considered to be a Conjunction ( I include Opposition in this script).
The objectives of this script are:
1. you can see the Hard Aspects schedule in certain periods, history and future.. (you can double check it in horoscopes.astro-seek.com )
2. this script allows you see based on specific aspect view, you can observe the correlation between the hard aspects and market reaction (is it turning or is it a swinghigh/ low?
Here are some examples;
SQUARE:
OPPOSITION
CONJUNCTION

Moon Phase , Eclipse & 4 SeasonsHi Traders,
This script is a little bit different than the others Moon Phase scripts, added Moon Eclipse and 4 Seasons..
The objectives of this script:
1. you can see the Moon Phase schedule at certain periods (you can double check it in mooncalendar.astro-seek.com)
2. you can see the correlation between the Moon Phase and market reaction
3. you can see the correlation between the Moon Eclipse and market reaction
4. you can see the correlation between the 4 Seasons and market reaction
Those Dates are the Moon Phase (history & future), so when the Moon Phase arrived, we can forecast the turning or swinghigh/low in the market (cryptos, stocks, commoditties & indexes), the turning or swinghigh/low is +/- 1 day.
Those lines are just a simply vertical lines that can help us backtest easily, hopefully we can take profit from this Moon Phase..
New Moon & Full Moon
New Moon
Full Moon
Moon Eclipse
4 Seasons (Spring Equinox, Summer Solstice, Autumn Equinox, Winter Solstice)
Futures Exchange SessionsIn the 24-hour trading of the futures market, this indicator provides the user with full customization concerning the most important factor: time. This indicator is centered around three main visualizations: labels, backgrounds, and lines that minimalistically allows the user to keep track of the many time intervals that occur during a futures market 24-hour trading cycle. It also artfully displays the previous days highs and lows. And everything can be individually toggled and configured so the user can get exactly what they want.
Labels
There are three main futures market sessions in a 24-hour period: the London, New York, and Asian Sessions. Each session is given an independent label for the open and close times. The six labels (LO, LC, NYO, NYC, AO, AC) can be individually toggled on or off, the label background color changed, the text switched between black or white, and the height can be lowered or raised. These customizations are intended to give the user full control of the session they are interested in at the moment.
Backgrounds
Backgrounds are the heart of this indicator. There are different colored transparent backgrounds for each of the futures sessions. So the user can clearly see the session they want to highlight without cluttering their chart and getting in the way of analyzing the candles.
If you are familiar with the London and New York killzones, these backgrounds are each individually configured.
If you are familiar with the Inner Circle Trader’s (ICT) NY Morning and Afternoon sessions, these are available. Also, most times weird price action occurs during the lunch hour of these sessions. The London and New York have a background for their respective lunch hours so the user is never caught of guard during these periods.
Lines
The markets are constantly looking for liquidity. To help the user see runs on liquidity, this indicator projects the previous days highs and lows on to the current day with a line and a price label. The line make it very easy to see where price may be headed. See the image below for the perfect example of this phenomenon. Each of the lines can be independently controlled by color, style, and width. And even the labels can be toggled on or off if the user would prefer just to see the lines. Lastly, there is a line that marks the midnight open price in EST.
Special Notes
This indicator is specifically designed for futures tickers.
All of the backgrounds are not designed to be turned on a once (there are many that overlap). They are designed to give the user ultimate control over exactly what timeframe backgrounds to display on their charts.
The labels only appear when timeframe is 1 hour or less.

Timed_exit_alert_for_webhookLibrary "Timed_exit_alert_for_webhook"
TODO: add library description here
fun(x) TODO: add function description here
Parameters:
x : TODO: add parameter x description here
Returns: TODO: add what function returns
for exiting FCM like Tradovate and AMP using API and python MT5 and Webhooks
the writer take no responsibility for trades made using this script its written for informational purposes only

[TTI] All-time-high (ATH), (ATL), 52 week high and low Dots––––History & Credit
I wanted to show our community the idea that stocks that make All Time High are likely to continue making ATHs for some time. It goes contrary to the idea "buy cheap sell high". Actually, in the real market leaders the stocks that make 100+% return are just getting started on returns to few THOUSAND percent. I have used code from QuantNovad scrip in this one too. So thanks to him as well, since it speeded writing it from scratch!
–––––What it does
The script paints dots and shows stats.
The dots are 4 types:
🟢 = Every time a new ATH is achieved, a green dot paints above the bar
🟣 = Every time a new 52week High is achieved, a purple dot paints above the bar
🟡 = Every time a new ATL is achieved, a yellow dot paints below the bar
🟠 = Every time a new 52week Low is achieved, a orange dot paints below the bar
Stats =
Show in a box in the bottom right corner of the screen. How many times has this stock achieved:
👉 ATHs
👉 52WK High
👉 ATLs
👉 52WK LOW
–––––How to use it
This is really an illustrative script to get the idea of the methodology "buy high sell higher', that we teach as momentum traders.
Some notable examples to check are:
HOOD
MSFT
TSLA
AAPL
See the stock dynamics and understand that bottom fishing doesn't result in stocks making massive moves.

Mean Shift Pivot ClusteringCore Concepts
According to Jeff Greenblatt in his book "Breakthrough Strategies for Predicting Any Market", Fibonacci and Lucas sequences are observed repeated in the bar counts from local pivot highs/lows. They occur from high to high, low to high, high to low, or low to high. Essentially, this phenomenon is observed repeatedly from any pivot points on any time frame. Greenblatt combines this observation with Elliott Waves to predict the price and time reversals. However, I am no Elliottician so it was not easy for me to use this in a practical manner. I decided to only use the bar count projections and ignore the price. I projected a subset of Fibonacci and Lucas sequences along with the Fibonacci ratios from each pivot point. As expected, a projection from each pivot point resulted in a large set of plotted data and looks like a huge gong show of lines. Surprisingly, I did notice clusters and have observed those clusters to be fairly accurate.
Fibonacci Sequence: 1, 2, 3, 5, 8, 13, 21, 34...
Lucas Sequence: 2, 1, 3, 4, 7, 11, 18, 29, 47...
Fibonacci Ratios (converted to whole numbers): 23, 38, 50, 61, 78, 127, 161...
Light Bulb Moment
My eyes may suck at grouping the lines together but what about clustering algorithms? I chose to use a gimped version of Mean Shift because it doesn't require me to know in advance how many lines to expect like K-Means. Mean shift is computationally expensive and with Pinescript's 500ms timeout, I had to make due without the KDE. In other words, I skipped the weighting part but I may try to incorporate it in the future. The code is from Harrison Kinsley . He's a fantastic teacher!
Usage
Search Radius: how far apart should the bars be before they are excluded from the cluster? Try to stick with a figure between 1-5. Too large a figure will give meaningless results.
Pivot Offset: looks left and right X number of bars for a pivot. Same setting as the default TradingView pivot high/low script.
Show Lines Back: show historical predicted lines. (These can change)
Use this script in conjunction with Fibonacci price retracement/extension levels and/or other support/resistance levels. If it's no where near a support/resistance and there's a projected time pivot coming up, it's probably a fake out.
Notes
Re-painting is intended. When a new pivot is found, it will project out the Fib/Lucas sequences so the algorithm will run again with additional information.
The script is for informational and educational purposes only.
Do not use this indicator by itself to trade!

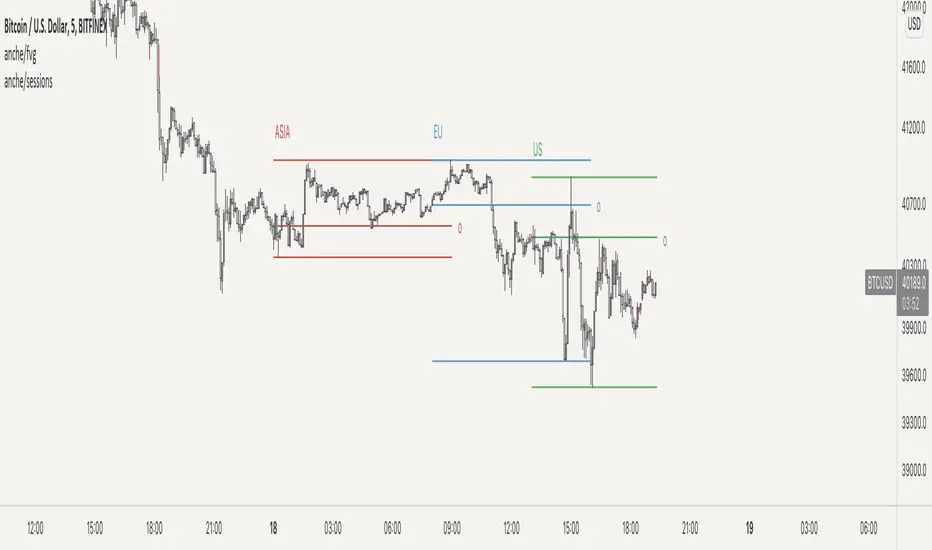
Market Sessions (including extended hours) by Anche█ MARKET SESSIONS BY ANCHE
this script allows you to define up to 4 different sessions and plot those on your chart. It makes it easy to see when these sessions started and ended and what the price level is when the session opened. It's for example beneficial to see when sessions overlap, because at those times there might be more volume , because more people are active within a market.
█ CONCEPTS
• plotting these sessions onto a chart can help you see overlap of 2 or more sessions. An overlap means more market participants, which can hint to an increase in volume .
• when the indicator shows all historic sessions, you can spot certain trends, for example that an asian market is generally more bearish and EU more bullish , or vice versa.
█ FEATURES
• up to 4 sessions
• customisable session labels
• customisable session times
• extended hours (on/off)
• timezone sync
• show past sessions
█ VISUAL FEATURES
• session plotted by top + bottom line or a box
• show session open
• customisable colors per session
• customisable lines (width/style/color)
• different visual settings for extended hours
• customisable label sizes
Price/Time CyclesThis is a script for laying out cycles of price & time that are square (though you can adjust the ratios)
There is an "Auto-cycle" option also
You may have to adjust the ratios of both time & price in different ways to get the right settings but you can experiment
Limit the amount of price lines you are displaying otherwise you may get some errors in the information plotted
(the script says max 10 but really there is no true maximum set & you will get missing information as it begins to plot too many lines... I'll try to define this in the future)
Remember you can put down multiple cycles & change the styling.
FOR LINE STYLE- please use this syntax:
Solid Line = sol
Dotted Line = dot
Dashed Line = dsh
(I'll try to setup options for that in the future)
You can lay cycles into the past using the horizontal offset tool but there is a limit of setting the info back beyond 5000 bars, also, generally this process is a bit funny
The script can only put vertical lines up to 500 bars into the future. So, although cycles of 500 bars or more can be used, the future bar will not be plotted until it is within 500 bars of the current bar. In other words, doing very long-term analysis or trying to lay higher timeframe bar counts onto smaller timeframes might not work & may be a buggy process

[DisDev] Market Maker | Technical Time AnalysisThis indicator has three main components: Days of Week Separators , User-Customized Reminder Notes , and Projected Lines . Each component is explained and demonstrated how it could be used as a trading tool.
The basis of this indicator is to analyze past price movements and then project them as a reminder for traders that previously, at that particular time, there was a price increase/decrease.
1) Vertical lines and labels separate days of the week.
a. The vertical lines allow you to quickly see what day of the week the price movement occurred. For example, if a notable price move happens on Monday, you can use the “Reminder Notes” input to enter a note directly on the chart, as explained below.
b. You can select different colors and styles for the lines or background.
2) Vertical lines can be customized to be displayed in the past and future.
a. This allows you to select a specific time when price has increased/decreased, see how often this has occurred, then notate it as a reminder in the future.
3) User-customized reminder notes for future projected lines.
a. This allows you to input notes to be displayed with the future projected lines.
b. Example: You notice that at 06:45, there had previously been significant price action. Your notes can be updated directly on the chart to remind you of them just before 06:45 on the following days.
Below is the indicator in full use.
You can adjust each line's style, width, color, and reminder notes.

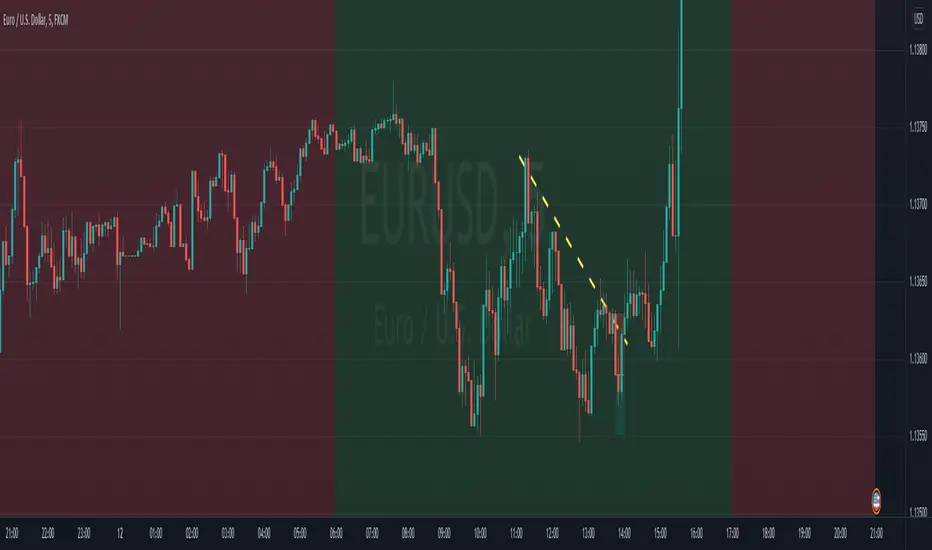
Time Session Filter - Visual Only - @Davi117 Simple visual adjustable time filter to highlight certain times of the day.
For instance if you only trade between 06:00 and 10:00 etc.
Includes Time Zone Selector using GMT
E.g if you live in London then you time zone will be just GMT, else if you live in Paris it would be GMT+1.
Ensure Trading View's time zone selection in the bottom right to the left of the Auto Scale toggle, is also set also set to your time zone, else it will be misaligned.
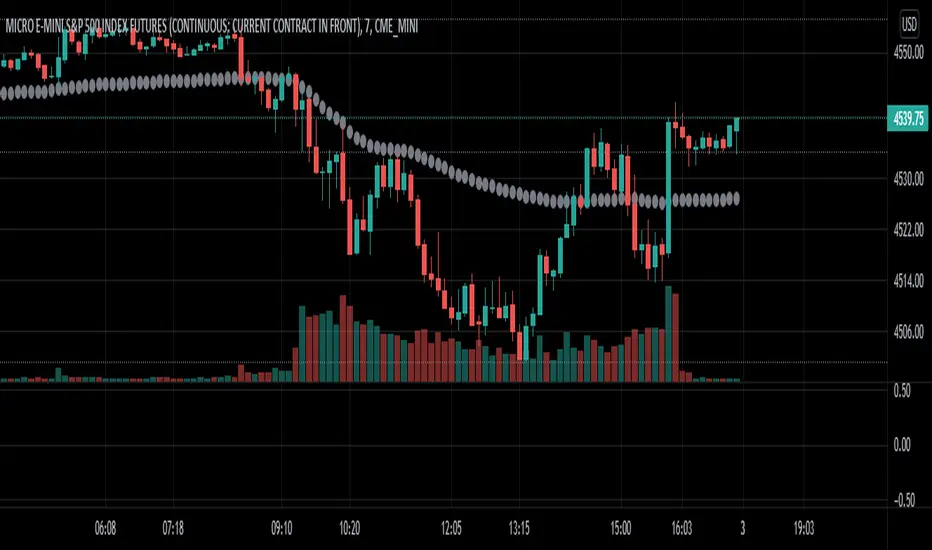
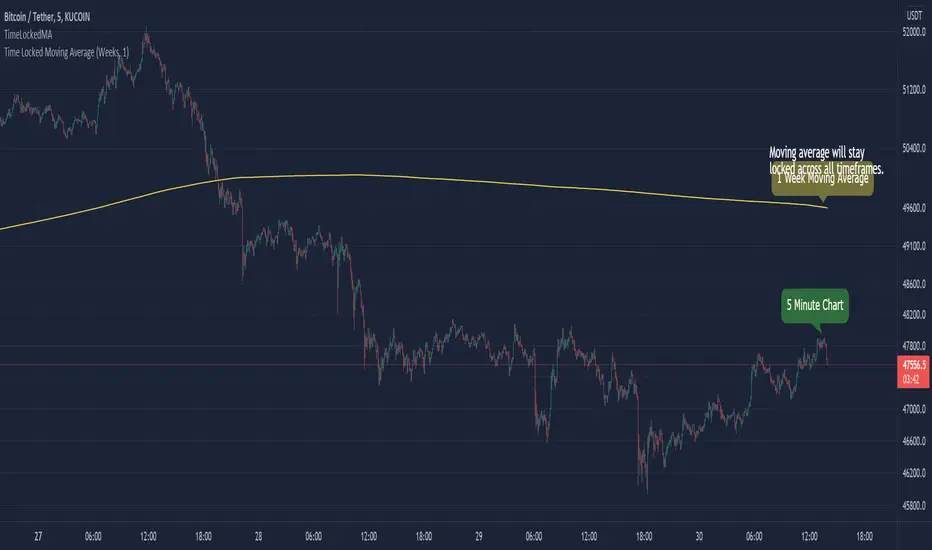
TimeLockedMALibrary "TimeLockedMA"
Library & function(s) which generates a moving average that stays locked to users desired time preference.
TODO - Add functionality for more moving average types. IE: smooth, weighted etc...
Example:
time_locked_ma(close, length=1, timeframe='days', type='ema')
Will generate a 1 day exponential moving average that will stay consistent across all chart intervals.
Error Handling
On small time frames with large moving averages (IE: 1min chart with a 50 week moving average), you'll get a study error that says "(function "sma") references too many candles in history" .
To fix this, make sure you have timeframe="" as an indicator() header. Next, in the indicator settings, increase the timeframe from to a higher interval until the error goes away.
By default, it's set to "Chart". Bringing the interval up to 1hr will usually solve the issue.
Furthermore, adding timeframe_gaps=false to your indicator() header will give you an approximation of real-time values.
Misc Info
For time_lock_ma() setting type='na' will return the relative length value that adjusts dynamically to user's chart time interval.
This is good for plugging into other functions where a lookback or length is required. (IE: Bollinger Bands)
time_locked_ma(source, length, timeframe, type) Creates a moving average that is locked to a desired timeframe
Parameters:
source : float, Moving average source
length : int, Moving average length
timeframe : string, Desired timeframe. Use: "minutes", "hours", "days", "weeks", "months", "chart"
type : string, string Moving average type. Use "SMA" (default) or "EMA". Value of "NA" will return relative lookback length.
Returns: moving average that is locked to desired timeframe.
timeframe_convert(t, a, b) Converts timeframe to desired timeframe. From a --> b
Parameters:
t : int, Time interval
a : string, Time period
b : string, Time period to convert to
Returns: Converted timeframe value
chart_time(timeframe_period, timeframe_multiplier) Separates timeframe.period function and returns chart interval and period
Parameters:
timeframe_period : string, timeframe.period
timeframe_multiplier : int, timeframe.multiplier
Enjoy :)
[5F] Multi clocks📋 Description :
This script displays three customizable clocks.
You can use it on chart too.
Works only in real time, not for replay.
🛠 Options :
Activate or not each clock
Time zone
Color and size in % of text and background
The script can be placed on the chart and in this case it is possible to change the position of each clock
Thanks to all Pinecoders who share their work with the community, in particular (non exhaustive list) :
LonesomeTheBlue, RafaelZioni, dgtrd, allanster, JayRogers , ChuckBanger, cheatcountry, NeoButane, ChrisMoody, QuantTherapy, J-Streak, makit0, john_everist, JustUncleL, everget, Duyck, KivancOzbilgic, LucF, HammondB3, blackcat1402, alexgrover, Mohamed3nan, DonovanWall, RicardoSantos, LazyBear, PRO_Indicators, theheirophant, midtownsk8rguy, e2e4mfck, SeaSide420, xel_arjona, RagingRocketBull, yatrader2, racer8, xdecow, Daveatt, QuantNomad, ceyhun, BigBitsIO, tista, aamonkey, rthomson, bgeraghty, pAulseperformance, rumpypumpydumpy
Another example :
