[iQ]PRO Quant GANN FOURIER VZO RANGE+🔮 PRO Quant GANN FOURIER VZO RANGE+
A Highly Adaptive and Proprietary Quantitative Strategy for Precision Market Analysis
This is the official description for the PRO Quant GANN FOURIER VZO RANGE+ strategy, a sophisticated, closed-source system engineered for high-level market engagement. This tool integrates multiple independent quantitative models into a single, cohesive Ensemble Signal, providing an edge through robust, multi-dimensional analysis.
🔬 Core Quantitative Architecture
The strategy is built on the convergence of several powerful, state-of-the-art analytical components, each designed to capture a distinct facet of market dynamics:
Proprietary Gann Swing Models: We utilize a dual-approach to Gann analysis.
Array–Based Gann Swing: A proprietary implementation leveraging advanced Pine Script array structures for dynamic tracking of significant price pivots and structure shifts. This component continuously monitors market momentum and potential areas of interest, including proprietary "ChoCh" (Change of Character) detection—a highly sensitive mechanism for identifying early trend inflection points. This core mechanism provides a high-frequency structural view of the market.
Composite Multi-Timeframe Gann Swing: This model synthesizes traditional swing analysis across two distinct timeframes to filter noise and confirm structural trends, ensuring the system operates with conviction against the backdrop of a higher-level market perspective.
VZO/VSA (Volume Zone Oscillator/Volume Spread Analysis) Hybrid: This module is engineered to analyze the crucial relationship between price momentum and volume flow, specifically using a Volume Zone Oscillator (VZO) approach integrated with Volume Spread Analysis (VSA) principles. It is designed to identify underlying accumulation and distribution activity with a unique dual-timeframe composite for enhanced signal quality.
Trend and Statistical Component: A dedicated module assesses the statistical bias and slope of the aggregated market movement, providing a crucial check against overextension and ensuring alignment with the underlying price regression trajectory.
⚖️ The Ensemble Signal and Trade Logic
All independent signals—Gann Array, Composite Gann, VZO/VSA, and Trend—are processed through a Weighted Ensemble Logic.
Weighted Voting: Each component's signal is assigned a customizable weight (input parameters wGannComp, wVZO, etc.) to reflect its relative importance in the current market environment.
Threshold-Based Decision: The weighted average of all signals results in an Ensemble Signal. Only when this signal decisively exceeds a customizable Signal Threshold does the system generate a Final Signal for trade execution. This rigor is key to filtering lower-conviction setups.
The strategy's execution logic is designed to open and close positions dynamically based on the Final Signal, maintaining maximum control with a default position size of 15% of equity per trade. A dedicated toggle allows for aggressive position management to "stay in" trades longer under specific conditions identified by the proprietary swing models.
⚙️ Strategic Advantages and Exclusivity
This strategy is marked by its extreme adaptability, incorporating features such as:
Higher Timeframe Synthesis: Crucial components utilize multi-timeframe confirmation to validate signals.
Price Smoothing: An optional, light-touch EMA smoothing is applied to the input price data to enhance signal clarity and reduce spurious whipsaws.
Due to the proprietary nature and complexity of the underlying swing detection algorithms and array management, the source code is kept strictly closed-source. This ensures the continued analytical edge and integrity of the model for our exclusive community.
OG INDICATOR TO MESS AROUND WITH, USE RIGHT, AND ENJOY. PRO STRATS COMING TOO
NFA.
MKNiQ
Tf
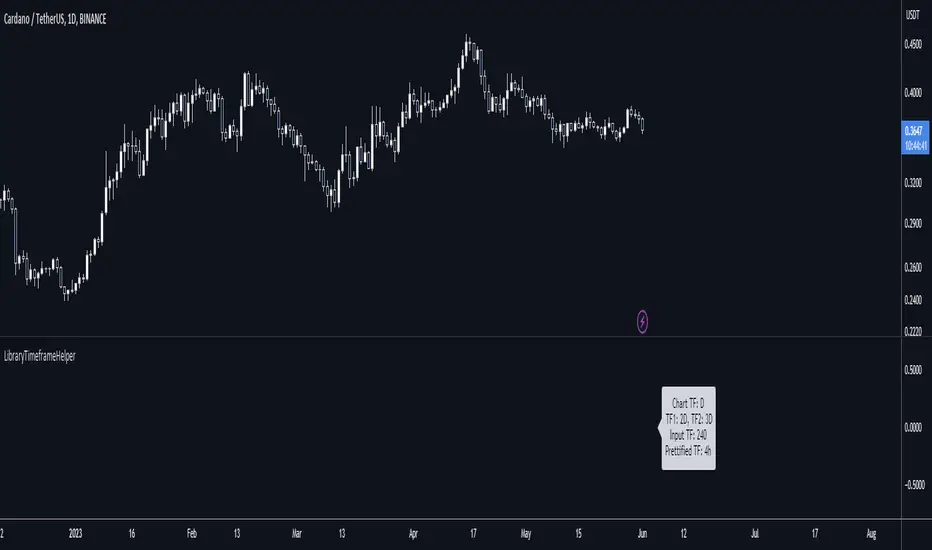
LibraryTimeframeHelperLibrary "LibraryTimeframeHelper"
Helper functions to work with timeframes: to get the next higher TF, and to make the string pretty for use in labels. Perhaps I'll add more later.
f_getHigherTF(_TF)
f_getHigherTF(): Converts the input timeframe into the next one up in the list of commonly used timeframes. NOTE: You can NOT use a TF from this function as input to a request.security() call if called from this library because it gets converted to a series (since there's nothing special about this function, I expect this probably goes for any library). However, you CAN copy the code and use it directly in your script, in which case the output is only a simple variable and thus suitable for the timeframe of a request.security() call.
Parameters:
_TF (string) - The timeframe to convert.
Returns: : A string in standard timeframe format.
f_prettifyTF(_TF)
f_prettifyTF(): Converts the input timeframe from standard timeframe format to the format shown by TradingView on a chart. The output is not suitable for use as an input timeframe of a request.security() call.
Parameters:
_TF (string) - The timeframe to convert.
Returns: : A string in prettified timeframe format.
3 TimeframesThis script allows you to overlay 2 other timeframes' open and close over your chart. It also has the option to overlay Heikin Ashi candles open and close over regular candles and vice versa, simply change the values in the settings. You can also set alerts for specific open/close.
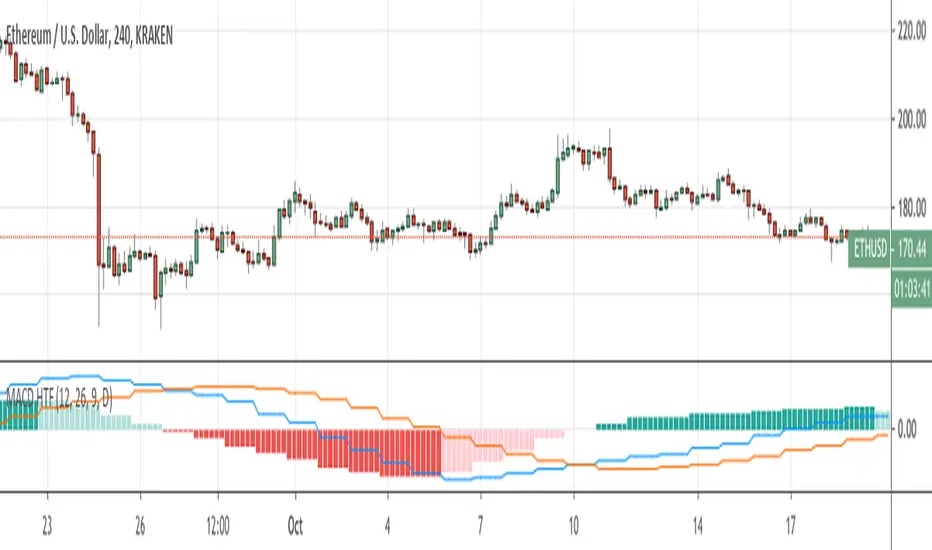
Heikin Ashi Historical TF Developmental BarsAn improvement to the built-in security(heikinashi()...) method, this indicator plots Heikin Ashi (HA) candles for an input timeframe (TF) on an underlying regular candlestick chart of a shorter TF. The improvement is that it plots the value of each in-development HA bar as it would have appeared while still repainting, for each underlying chart bar. The last chart bar of each TF matches the value available from security() calls and from HA charts directly.
For best results, be sure to use a HA TF greater than chart TF (I prefer 1 minute unless longer history is required).
1 hour HA on 1 minute underlying price chart
4 hour HA on 1 minute underlying price chart
V3: Release.
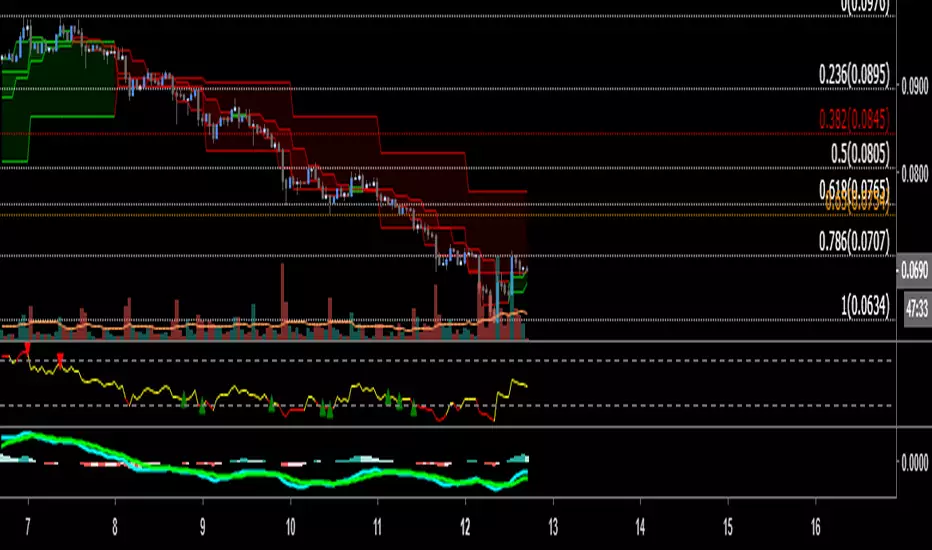
Heikin Ashi Historical TF Candles, with AlertsRunning on 1-minute regular candle chart, this indicator plots the HA candles of any timeframe, recalculating the in-process values of that candle during each minute of its life.
Also contains our AV trading signals, and data gap detection/trade prohibition.
V72: New indicator.
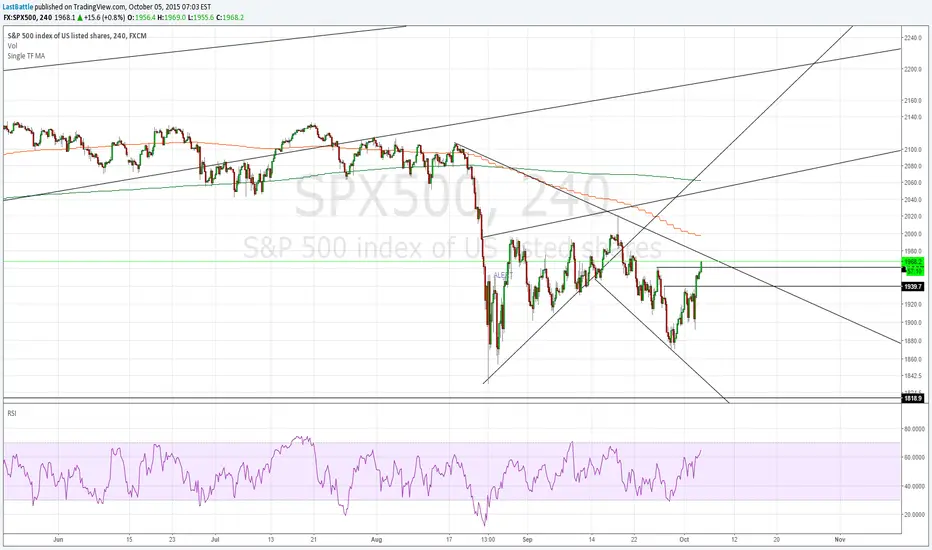
Single Timeframe Moving AverageProvides Moving average of 200 and 50 at the specific timeframe regardless of what interval you're looking at.
Saving the need to change it manually each time you switch the interval.
In this chart, I am looking at 4H interval with EMA of 50/200 of daily timeframe.


