VolumeFlowOscillatorLibVolume Flow Oscillator Library
Overview
The Volume Flow Oscillator library provides a comprehensive framework for analyzing directional volume flow in financial markets. It creates a multi-band oscillator system that transforms price and volume data into a spectrum of sensitivity bands, revealing the underlying buying and selling pressure.
Technical Approach
The library combines price direction with trading volume to generate an oscillator that fluctuates around a zero line, with positive values indicating buying pressure and negative values showing selling pressure. Using sophisticated ALMA (Arnaud Legoux Moving Average) smoothing techniques with asymmetric sensitivity, the library creates seven distinct bands that help identify various intensity levels of volume flow.
Key Features
Multi-band oscillator system with seven sensitivity levels
Directional volume flow analysis combining price movement and volume
Zero-line oscillation showing the balance between buying and selling pressure
Asymmetric ALMA smoothing for different sensitivity on positive/negative bands
Customizable lookback periods and multipliers for fine-tuning
Color-coded visualization for intuitive chart reading
Applications
This library offers developers a versatile foundation for creating volume-based indicators that go beyond simple volume measurement to reveal the directional force behind market movements. Ideal for confirming price trends, detecting divergences, identifying volume climaxes, and assessing overall market strength.
Techindicator

KTUtilsLibrary "KTUtils"
Utility functions for technical analysis indicators, trend detection, and volatility confirmation.
MGz(close, length)
MGz
@description Moving average smoother used for signal processing
Parameters:
close (float) : float Price input (typically close)
length (int) : int Length of smoothing period
Returns: float Smoothed value
atrConf(length)
atrConf
@description Calculates Average True Range (ATR) for volatility confirmation
Parameters:
length (simple int) : int Length for ATR calculation
Returns: float ATR value
f(input)
f
@description Simple Moving Average with fixed length
Parameters:
input (float) : float Input value
Returns: float Smoothed average
bcwSMA(s, l, m)
bcwSMA
@description Custom smoothing function with weight multiplier
Parameters:
s (float) : float Signal value
l (int) : int Length of smoothing
m (int) : int Weighting multiplier
Returns: float Smoothed output
MGxx(close, length)
MGxx
@description Custom Weighted Moving Average (WMA) variant
Parameters:
close (float) : float Price input
length (int) : int Period length
Returns: float MGxx smoothed output
_PerChange(lengthTime)
_PerChange
@description Measures percentage price change over a period and range deviation
Parameters:
lengthTime (int) : int Period for change measurement
Returns: tuple Measured change, high deviation, low deviation
dirmov(len)
dirmov
@description Calculates directional movement components
Parameters:
len (simple int) : int Lookback period
Returns: tuple Plus and Minus DI values
adx(dilen, adxlen)
adx
@description Calculates Average Directional Index (ADX)
Parameters:
dilen (simple int) : int Length for DI calculation
adxlen (simple int) : int Length for ADX smoothing
Returns: float ADX value
trChopAnalysis()
trChopAnalysis
@description Identifies chop and trend phases based on True Range Bollinger Bands
Returns: tuple TR SMA, chop state, trending state
wtiAnalysis(haclose, close, filterValue)
wtiAnalysis
@description Wave Trend Indicator (WTI) with signal crossover logic
Parameters:
haclose (float) : float Heikin-Ashi close
close (float) : float Standard close
filterValue (simple int) : int Smoothing length
Returns: tuple WTI lines and direction states
basicTrend(hahigh, halow, close, open, filterValue)
basicTrend
@description Determines trend direction based on HA high/low and close
Parameters:
hahigh (float) : float Heikin-Ashi high
halow (float) : float Heikin-Ashi low
close (float) : float Standard close
open (float) : float Standard open
filterValue (simple int) : int Smoothing period
Returns: tuple Uptrend, downtrend flags
metrics(close, filterValue)
metrics
@description Common market metrics
Parameters:
close (float) : float Price input
filterValue (int) : int RSI smoothing length
Returns: tuple VWMA, SMA10, RSI, smoothed RSI
piff(close, trend_change)
piff
@description Price-Informed Forward Forecasting (PIFF) model for trend strength
Parameters:
close (float) : float Price input
trend_change (float) : float Change in trend
Returns: tuple Percent change, flags for trend direction
getMACD()
getMACD
@description Returns MACD, signal line, and histogram
Returns: tuple MACD line, Signal line, Histogram
getStoch()
getStoch
@description Returns K and D lines of Stochastic Oscillator
Returns: tuple K and D lines
getKDJ()
getKDJ
@description KDJ momentum oscillator
Returns: tuple K, D, J, Average
getBBRatio()
getBBRatio
@description Bollinger Band Ratio (BBR) and signal flags
Returns: tuple Basis, Upper, Lower, BBR, BBR Up, BBR Down
getSupertrend()
getSupertrend
@description Supertrend values and direction flags
Returns: tuple Supertrend, Direction, Up, Down

remaLibrary " REMA "
Custom Regional Exponential Moving Average with enhanced sensitivity to recent price action
Description: What Makes REMA Unique?
REMA introduces a dual-region weighting system that intelligently balances short-term responsiveness with long-term trend context, solving the fundamental limitation of standard EMAs where longer periods necessarily sacrifice recent price sensitivity.
Key Differences from Standard EMA:
Adaptive Regional Weighting: Applies stronger exponential decay to recent price data while maintaining appropriate weighting for historical context.
Maintains Responsiveness at Any Length: Unlike standard EMAs where longer periods become progressively less responsive, REMA preserves significant sensitivity to recent price action even at 100+ period lengths.
Mathematically Sound Enhancement: Preserves the core mathematical integrity of exponential averaging while introducing region-specific weighting that better reflects how traders actually interpret price action.
Value to TradingView Community:
Improved Signal Timing: Detects reversals 1-3 bars earlier than traditional EMAs without increasing false signals.
Better Multi-Timeframe Analysis: Provides more consistent behavior across different period settings, reducing conflicting signals between timeframes.
Ideal for Modern Markets: Better handles today's high-volatility, algorithm-driven markets where traditional indicators often lag too much to be effective.
Optimized for Both Trend and Reversal Trading: Simultaneously provides strong trend-following capabilities while remaining sensitive to legitimate reversal signals.
Computation Efficiency: The fast implementation offers enhanced capabilities with minimal computational overhead, making it practical for real-time analysis.
REMA fills a critical gap between lagging long-period EMAs and noisy short-period EMAs, giving traders a single, versatile tool that adapts to market conditions more effectively than standard technical indicators.
Implementation:
rema(src, length, recency_bias, transition_point)
Regional Exponential Moving Average that maintains recent price sensitivity even with long lookback periods
Parameters:
src (float) : Input source series
length (int) : Overall EMA period length
recency_bias (float) : Weighting factor to increase sensitivity to recent prices (1.0-3.0 recommended)
transition_point (float) : Percentage point (0.0-1.0) in the lookback period where weighting shifts from recent to historical
Returns: Custom exponentially weighted moving average with regional bias
rema_fast(src, length, recency_bias)
Simplified Regional EMA that uses a recursive calculation method
Parameters:
src (float) : Input source series
length (int) : Overall EMA period
recency_bias (float) : Factor to increase sensitivity to recent price (1.0-3.0 recommended)
Returns: Computationally efficient regional EMA
AllCandlestickPatternsLibraryAll Candlestick Patterns Library
The Candlestick Patterns Library is a Pine Script (version 6) library extracted from the All Candlestick Patterns indicator. It provides a comprehensive set of functions to calculate candlestick properties, detect market trends, and identify various candlestick patterns (bullish, bearish, and neutral). The library is designed for reusability, enabling TradingView users to incorporate pattern detection into their own scripts, such as indicators or strategies.
The library is organized into three main sections:
Trend Detection: Functions to determine market trends (uptrend or downtrend) based on user-defined rules.
Candlestick Property Calculations: A function to compute core properties of a candlestick, such as body size, shadow lengths, and doji characteristics.
Candlestick Pattern Detection: Functions to detect specific candlestick patterns, each returning a tuple with detection status, pattern name, type, and description.
Library Structure
1. Trend Detection
This section includes the detectTrend function, which identifies whether the market is in an uptrend or downtrend based on user-specified rules, such as the relationship between the closing price and Simple Moving Averages (SMAs).
Function: detectTrend
Parameters:
downTrend (bool): Initial downtrend condition.
upTrend (bool): Initial uptrend condition.
trendRule (string): The rule for trend detection ("SMA50" or "SMA50, SMA200").
p_close (float): Current closing price.
sma50 (float): Simple Moving Average over 50 periods.
sma200 (float): Simple Moving Average over 200 periods.
Returns: A tuple indicating the detected trend.
Logic:
If trendRule is "SMA50", a downtrend is detected when p_close < sma50, and an uptrend when p_close > sma50.
If trendRule is "SMA50, SMA200", a downtrend is detected when p_close < sma50 and sma50 < sma200, and an uptrend when p_close > sma50 and sma50 > sma200.
2. Candlestick Property Calculations
This section includes the calculateCandleProperties function, which computes essential properties of a candlestick based on OHLC (Open, High, Low, Close) data and configuration parameters.
Function: calculateCandleProperties
Parameters:
p_open (float): Candlestick open price.
p_close (float): Candlestick close price.
p_high (float): Candlestick high price.
p_low (float): Candlestick low price.
bodyAvg (float): Average body size (e.g., from EMA of body sizes).
shadowPercent (float): Minimum shadow size as a percentage of body size.
shadowEqualsPercent (float): Tolerance for equal shadows in doji detection.
dojiBodyPercent (float): Maximum body size as a percentage of range for doji detection.
Returns: A tuple containing 17 properties:
C_BodyHi (float): Higher of open or close price.
C_BodyLo (float): Lower of open or close price.
C_Body (float): Body size (difference between C_BodyHi and C_BodyLo).
C_SmallBody (bool): True if body size is below bodyAvg.
C_LongBody (bool): True if body size is above bodyAvg.
C_UpShadow (float): Upper shadow length (p_high - C_BodyHi).
C_DnShadow (float): Lower shadow length (C_BodyLo - p_low).
C_HasUpShadow (bool): True if upper shadow exceeds shadowPercent of body.
C_HasDnShadow (bool): True if lower shadow exceeds shadowPercent of body.
C_WhiteBody (bool): True if candle is bullish (p_open < p_close).
C_BlackBody (bool): True if candle is bearish (p_open > p_close).
C_Range (float): Candlestick range (p_high - p_low).
C_IsInsideBar (bool): True if current candle body is inside the previous candle's body.
C_BodyMiddle (float): Midpoint of the candle body.
C_ShadowEquals (bool): True if upper and lower shadows are equal within shadowEqualsPercent.
C_IsDojiBody (bool): True if body size is small relative to range (C_Body <= C_Range * dojiBodyPercent / 100).
C_Doji (bool): True if the candle is a doji (C_IsDojiBody and C_ShadowEquals).
Purpose: These properties are used by pattern detection functions to evaluate candlestick formations.
3. Candlestick Pattern Detection
This section contains functions to detect specific candlestick patterns, each returning a tuple . The patterns are categorized as bullish, bearish, or neutral, and include detailed descriptions for use in tooltips or alerts.
Supported Patterns
The library supports the following candlestick patterns, grouped by type:
Bullish Patterns:
Rising Window: A two-candle continuation pattern in an uptrend with a price gap between the first candle's high and the second candle's low.
Rising Three Methods: A five-candle continuation pattern with a long green candle, three short red candles, and another long green candle.
Tweezer Bottom: A two-candle reversal pattern in a downtrend with nearly identical lows.
Upside Tasuki Gap: A three-candle continuation pattern in an uptrend with a gap between the first two green candles and a red candle closing partially into the gap.
Doji Star (Bullish): A two-candle reversal pattern in a downtrend with a long red candle followed by a doji gapping down.
Morning Doji Star: A three-candle reversal pattern with a long red candle, a doji gapping down, and a long green candle.
Piercing: A two-candle reversal pattern in a downtrend with a red candle followed by a green candle closing above the midpoint of the first.
Hammer: A single-candle reversal pattern in a downtrend with a small body and a long lower shadow.
Inverted Hammer: A single-candle reversal pattern in a downtrend with a small body and a long upper shadow.
Morning Star: A three-candle reversal pattern with a long red candle, a short candle gapping down, and a long green candle.
Marubozu White: A single-candle pattern with a long green body and minimal shadows.
Dragonfly Doji: A single-candle reversal pattern in a downtrend with a doji where open and close are at the high.
Harami Cross (Bullish): A two-candle reversal pattern in a downtrend with a long red candle followed by a doji inside its body.
Harami (Bullish): A two-candle reversal pattern in a downtrend with a long red candle followed by a small green candle inside its body.
Long Lower Shadow: A single-candle pattern with a long lower shadow indicating buyer strength.
Three White Soldiers: A three-candle reversal pattern with three long green candles in a downtrend.
Engulfing (Bullish): A two-candle reversal pattern in a downtrend with a small red candle followed by a larger green candle engulfing it.
Abandoned Baby (Bullish): A three-candle reversal pattern with a long red candle, a doji gapping down, and a green candle gapping up.
Tri-Star (Bullish): A three-candle reversal pattern with three doji candles in a downtrend, with gaps between them.
Kicking (Bullish): A two-candle reversal pattern with a bearish marubozu followed by a bullish marubozu gapping up.
Bearish Patterns:
On Neck: A two-candle continuation pattern in a downtrend with a long red candle followed by a short green candle closing near the first candle's low.
Falling Window: A two-candle continuation pattern in a downtrend with a price gap between the first candle's low and the second candle's high.
Falling Three Methods: A five-candle continuation pattern with a long red candle, three short green candles, and another long red candle.
Tweezer Top: A two-candle reversal pattern in an uptrend with nearly identical highs.
Dark Cloud Cover: A two-candle reversal pattern in an uptrend with a green candle followed by a red candle opening above the high and closing below the midpoint.
Downside Tasuki Gap: A three-candle continuation pattern in a downtrend with a gap between the first two red candles and a green candle closing partially into the gap.
Evening Doji Star: A three-candle reversal pattern with a long green candle, a doji gapping up, and a long red candle.
Doji Star (Bearish): A two-candle reversal pattern in an uptrend with a long green candle followed by a doji gapping up.
Hanging Man: A single-candle reversal pattern in an uptrend with a small body and a long lower shadow.
Shooting Star: A single-candle reversal pattern in an uptrend with a small body and a long upper shadow.
Evening Star: A three-candle reversal pattern with a long green candle, a short candle gapping up, and a long red candle.
Marubozu Black: A single-candle pattern with a long red body and minimal shadows.
Gravestone Doji: A single-candle reversal pattern in an uptrend with a doji where open and close are at the low.
Harami Cross (Bearish): A two-candle reversal pattern in an uptrend with a long green candle followed by a doji inside its body.
Harami (Bearish): A two-candle reversal pattern in an uptrend with a long green candle followed by a small red candle inside its body.
Long Upper Shadow: A single-candle pattern with a long upper shadow indicating seller strength.
Three Black Crows: A three-candle reversal pattern with three long red candles in an uptrend.
Engulfing (Bearish): A two-candle reversal pattern in an uptrend with a small green candle followed by a larger red candle engulfing it.
Abandoned Baby (Bearish): A three-candle reversal pattern with a long green candle, a doji gapping up, and a red candle gapping down.
Tri-Star (Bearish): A three-candle reversal pattern with three doji candles in an uptrend, with gaps between them.
Kicking (Bearish): A two-candle reversal pattern with a bullish marubozu followed by a bearish marubozu gapping down.
Neutral Patterns:
Doji: A single-candle pattern with a very small body, indicating indecision.
Spinning Top White: A single-candle pattern with a small green body and long upper and lower shadows, indicating indecision.
Spinning Top Black: A single-candle pattern with a small red body and long upper and lower shadows, indicating indecision.
Pattern Detection Functions
Each pattern detection function evaluates specific conditions based on candlestick properties (from calculateCandleProperties) and trend conditions (from detectTrend). The functions return:
detected (bool): True if the pattern is detected.
name (string): The name of the pattern (e.g., "On Neck").
type (string): The pattern type ("Bullish", "Bearish", or "Neutral").
description (string): A detailed description of the pattern for use in tooltips or alerts.
For example, the detectOnNeckBearish function checks for a bearish On Neck pattern by verifying a downtrend, a long red candle followed by a short green candle, and specific price relationships.
Usage Example
To use the library in a TradingView indicator, you can import it and call its functions as shown below:
//@version=6
indicator("Candlestick Pattern Detector", overlay=true)
import CandlestickPatternsLibrary as cp
// Calculate SMA for trend detection
sma50 = ta.sma(close, 50)
sma200 = ta.sma(close, 200)
= cp.detectTrend(true, true, "SMA50", close, sma50, sma200)
// Calculate candlestick properties
bodyAvg = ta.ema(math.max(close, open) - math.min(close, open), 14)
= cp.calculateCandleProperties(open, close, high, low, bodyAvg, 5.0, 100.0, 5.0)
// Detect a pattern (e.g., On Neck Bearish)
= cp.detectOnNeckBearish(downTrend, blackBody, longBody, whiteBody, open, close, low, bodyAvg, smallBody, candleRange)
if onNeckDetected
label.new(bar_index, low, onNeckName, style=label.style_label_up, color=color.red, textcolor=color.white, tooltip=onNeckDesc)
// Detect another pattern (e.g., Piercing Bullish)
= cp.detectPiercingBullish(downTrend, blackBody, longBody, whiteBody, open, low, close, bodyMiddle)
if piercingDetected
label.new(bar_index, low, piercingName, style=label.style_label_up, color=color.blue, textcolor=color.white, tooltip=piercingDesc)
Steps in the Example
Import the Library: Use import CandlestickPatternsLibrary as cp to access the library's functions.
Calculate Trend: Use detectTrend to determine the market trend based on SMA50 or SMA50/SMA200 rules.
Calculate Candlestick Properties: Use calculateCandleProperties to compute properties like body size, shadow lengths, and doji status.
Detect Patterns: Call specific pattern detection functions (e.g., detectOnNeckBearish, detectPiercingBullish) and use the returned values to display labels or alerts.
Visualize Patterns: Use label.new to display detected patterns on the chart with their names, types, and descriptions.
Key Features
Modularity: The library is designed as a standalone module, making it easy to integrate into other Pine Script projects.
Comprehensive Pattern Coverage: Supports over 40 candlestick patterns, covering bullish, bearish, and neutral formations.
Detailed Documentation: Each function includes comments with @param and @returns annotations for clarity.
Reusability: Can be used in indicators, strategies, or alerts by importing the library and calling its functions.
Extracted from All Candlestick Patterns: The library is derived from the All Candlestick Patterns indicator, ensuring it inherits a well-tested foundation for pattern detection.
Notes for Developers
Pine Script Version: The library uses Pine Script version 6, as specified by //@version=6.
Parameter Naming: Parameters use prefixes like p_ (e.g., p_open, p_close) to avoid conflicts with built-in variables.
Error Handling: The library has been fixed to address issues like undeclared identifiers (C_SmallBody, C_Range), unused arguments (factor), and improper comment formatting.
Testing: Developers should test the library in TradingView to ensure patterns are detected correctly under various market conditions.
Customization: Users can adjust parameters like bodyAvg, shadowPercent, shadowEqualsPercent, and dojiBodyPercent in calculateCandleProperties to fine-tune pattern detection sensitivity.
Conclusion
The Candlestick Patterns Library, extracted from the All Candlestick Patterns indicator, is a powerful tool for traders and developers looking to implement candlestick pattern detection in TradingView. Its modular design, comprehensive pattern support, and detailed documentation make it an ideal choice for building custom indicators or strategies. By leveraging the library's functions, users can analyze market trends, compute candlestick properties, and detect a wide range of patterns to inform their trading decisions.

WhispererRealtimeVolumeLibrary "WhispererRealtimeVolume"
▮ Overview
The Whisperer Realtime Volume Library is a lightweight and reusable Pine Script® library designed for real-time volume analysis.
It calculates up, down, and neutral volumes dynamically, making it an essential tool for traders who want to gain deeper insights into market activity.
This library is a simplified and modular version of the original "Realtime Volume Bars w Market Buy/Sell/Neutral split & Mkt Delta" indicator by the_MarketWhisperer , tailored for integration into custom scripts.
How bars are classified
- Up Bars
If the current bar’s closing price is higher than the previous bar’s closing price, it is classified as an up bar.
Volume handling:
The increase in volume for this bar is added to the up volume.
This represents buying pressure.
- Down Bars
If the current bar’s closing price is lower than the previous bar’s closing price, it is classified as a down bar.
Volume handling:
The increase in volume for this bar is added to the down volume.
This represents selling pressure.
- Neutral Bars
If the current bar’s closing price is the same as the previous bar’s closing price, it is classified as a neutral bar.
Volume handling:
If neutral volume is enabled, the volume is added to the neutral volume.
If neutral volume is not enabled, the volume is assigned to the same direction as the previous bar (up or down). If the previous direction is unknown, it is added to the neutral volume.
▮ What to look for
Real-Time Volume Calculation : Analyze up, down, and neutral volumes in real-time based on price movements and bar volume.
Customizable Start Line : Add a visual reference line to your chart for better context by viewing the starting point of real-time bars.
Ease of Integration : Designed as a library for seamless use in other Pine Script® indicators or strategies.
▮ How to use
Example code:
//@version=6
indicator("Volume Realtime from Whisperer")
import andre_007/WhispererRealtimeVolume/4 as MW
MW.displayStartLine(startLineColor = color.gray, startLineWidth = 1, startLineStyle = line.style_dashed,
displayStartLine = true, y1=volume, y2=volume + 10)
= MW.mw_upDownVolumeRealtime(true)
plot(volume, style=plot.style_columns, color=color.gray)
plot(volumeUp, style=plot.style_columns, color=color.green)
plot(volumeDown, style=plot.style_columns, color=color.red)
plot(volumeNeutral, style=plot.style_columns, color=color.purple)
▮ Credits
This library is inspired by the original work of the_MarketWhisperer , whose "Realtime Volume Bars" indicator served as the foundation.
Link to original indicator :

reversalchartpatternsLibrary "reversalchartpatterns"
User Defined Types and Methods for reversal chart patterns - Double Top, Double Bottom, Triple Top, Triple Bottom, Cup and Handle, Inverted Cup and Handle, Head and Shoulders, Inverse Head and Shoulders
method delete(this)
Deletes the drawing components of ReversalChartPatternDrawing object
Namespace types: ReversalChartPatternDrawing
Parameters:
this (ReversalChartPatternDrawing) : ReversalChartPatternDrawing object
Returns: current ReversalChartPatternDrawing object
method delete(this)
Deletes the drawing components of ReversalChartPattern object. In turn calls the delete of ReversalChartPatternDrawing
Namespace types: ReversalChartPattern
Parameters:
this (ReversalChartPattern) : ReversalChartPattern object
Returns: current ReversalChartPattern object
method lpush(this, obj, limit, deleteOld)
Array push with limited number of items in the array. Old items are deleted when new one comes and exceeds the limit
Namespace types: array
Parameters:
this (array) : array object
obj (ReversalChartPattern) : ReversalChartPattern object which need to be pushed to the array
limit (int) : max items on the array. Default is 10
deleteOld (bool) : If set to true, also deletes the drawing objects. If not, the drawing objects are kept but the pattern object is removed from array. Default is false.
Returns: current ReversalChartPattern object
method draw(this)
Draws the components of ReversalChartPatternDrawing
Namespace types: ReversalChartPatternDrawing
Parameters:
this (ReversalChartPatternDrawing) : ReversalChartPatternDrawing object
Returns: current ReversalChartPatternDrawing object
method draw(this)
Draws the components of ReversalChartPatternDrawing within the ReversalChartPattern object.
Namespace types: ReversalChartPattern
Parameters:
this (ReversalChartPattern) : ReversalChartPattern object
Returns: current ReversalChartPattern object
method scan(zigzag, patterns, errorPercent, shoulderStart, shoulderEnd, allowedPatterns, offset)
Scans zigzag for ReversalChartPattern occurences
Namespace types: zg.Zigzag
Parameters:
zigzag (Zigzag type from Trendoscope/Zigzag/11) : ZigzagTypes.Zigzag object having array of zigzag pivots and other information on each pivots
patterns (array) : Existing patterns array. Used for validating duplicates
errorPercent (float) : Error threshold for considering ratios. Default is 13
shoulderStart (float) : Starting range of shoulder ratio. Used for identifying shoulders, handles and necklines
shoulderEnd (float) : Ending range of shoulder ratio. Used for identifying shoulders, handles and necklines
allowedPatterns (array) : array of int containing allowed pattern types
offset (int) : Offset of zigzag to consider only confirmed pivots
Returns: int pattern type
method createPattern(zigzag, patternType, patternColor, properties, offset)
Create Pattern from ZigzagTypes.Zigzag object
Namespace types: zg.Zigzag
Parameters:
zigzag (Zigzag type from Trendoscope/Zigzag/11) : ZigzagTypes.Zigzag object having array of zigzag pivots and other information on each pivots
patternType (int) : Type of pattern being created. 1 - Double Tap, 2 - Triple Tap, 3 - Cup and Handle, 4 - Head and Shoulders
patternColor (color) : Color in which the patterns are drawn
properties (ReversalChartTradeProperties)
offset (int)
Returns: ReversalChartPattern object created
method getName(this)
get pattern name of ReversalChartPattern object
Namespace types: ReversalChartPattern
Parameters:
this (ReversalChartPattern) : ReversalChartPattern object
Returns: string name of the pattern
method getDescription(this)
get consolidated description of ReversalChartPattern object
Namespace types: ReversalChartPattern
Parameters:
this (ReversalChartPattern) : ReversalChartPattern object
Returns: string consolidated description
method init(this)
initializes the ReversalChartPattern object and creates sub object types
Namespace types: ReversalChartPattern
Parameters:
this (ReversalChartPattern) : ReversalChartPattern object
Returns: ReversalChartPattern current object
ReversalChartPatternDrawing
Type which holds the drawing objects for Reversal Chart Pattern Types
Fields:
patternLines (array type from Trendoscope/Drawing/2) : array of Line objects representing pattern
entry (Line type from Trendoscope/Drawing/2) : Entry price Line
targets (array type from Trendoscope/Drawing/2)
stop (Line type from Trendoscope/Drawing/2) : Stop price Line
patternLabel (Label type from Trendoscope/Drawing/2)
ReversalChartTradeProperties
Trade properties of ReversalChartPattern
Fields:
riskAdjustment (series float) : Risk Adjustment for calculation of stop
useFixedTarget (series bool) : Boolean flag saying use fixed target type wherever possible. If fixed target type is not possible, then risk reward/fib ratios are used for calculation of targets
variableTargetType (series int) : Integer value which defines whether to use fib based targets or risk reward based targets. 1 - Risk Reward, 2 - Fib Ratios
variableTargetRatios (array) : Risk reward or Fib Ratios to be used for calculation of targets when fixed target is not possible or not enabled
entryPivotForWm (series int) : which Pivot should be considered as entry point for WM patterns. 0 refers to the latest breakout pivot where as 5 refers to initial pivot of the pattern
ReversalChartPattern
Reversal Chart Pattern master type which holds the pattern components, drawings and trade details
Fields:
pivots (array type from Trendoscope/Zigzag/11) : Array of Zigzag Pivots forming the pattern
patternType (series int) : Defines the main type of pattern 1 - Double Tap, 1 - Triple Tap, 3 - Cup and Handle, 4 - Head and Shoulders, 5- W/M Patterns, 6 - Full Trend, 7 - Half Trend
patternColor (series color) : Color in which the pattern will be drawn on chart
properties (ReversalChartTradeProperties)
drawing (ReversalChartPatternDrawing) : ReversalChartPatternDrawing object which holds the drawing components
trade (Trade type from Trendoscope/TradeTracker/1) : TradeTracker.Trade object holding trade components

CandlestickUtilitiesThis library provides essential functions for candlestick chart analysis and pattern recognition in Pine Script®.
It includes:
• Candle structure analysis (bodies, shadows, lengths)
• Trend detection using EMAs
• Common candlestick pattern recognition
This library is under construction.
Designed to support strategy development and improve signal accuracy for traders.
Created by @xprophetx — under MPL-2.0 license.

tafirstlibGeneral Purpose: Starts by stating it's a collection of utility functions for technical analysis.
Core Functionality Areas: Mentions key categories like:
Extrema detection (isMin, isMax, etc.)
Condition checking over time (isMachedInRange, isContinuous, etc.)
Rate of change analysis (isSlowDown)
Moving average calculation (getMA)
Advanced Features: Highlights the more complex functions:
Visualization helpers (getColorNew)
Moving Regression (mr) for smoothing/trend
Cycle analysis (bpDom)
Overall Goal: Concludes by stating the library's aim – simplifying development and enabling complex analysis.
Library "tafirstlib"
TODO: add library description here
isSlowDown(data)
isSlowDown
Parameters:
data (float) : array of numbers
Returns: boolean
isMin(data, maeLength)
isMin
Parameters:
data (float) : array of numbers
maeLength (int) : number
Returns: boolean
isMax(data, maeLength)
isMax
Parameters:
data (float) : array of numbers
maeLength (int) : number
Returns: boolean
isMinStopped(data, maeLength)
isMinStopped
Parameters:
data (float) : array of numbers
maeLength (int) : number
Returns: boolean
isMaxStopped(data, maeLength)
isMaxStopped
Parameters:
data (float) : array of numbers
maeLength (int) : number
Returns: boolean
isLongMinStopped(data, maeLength, distance)
isLongMinStopped
Parameters:
data (float) : array of numbers
maeLength (int) : number
distance (int) : number
Returns: boolean
isLongMaxStopped(data, maeLength, distance)
isLongMaxStopped
Parameters:
data (float) : array of numbers
maeLength (int) : number
distance (int) : number
Returns: boolean
isMachedInRangeSkipCurrent(data, findRange, findValue)
isMachedInRangeSkipCurrent
Parameters:
data (bool) : array of numbers
findRange (int) : number
findValue (bool) : number
Returns: boolean
isMachedInRange(data, findRange, findValue)
isMachedInRange
Parameters:
data (bool) : array of numbers
findRange (int) : number
findValue (bool) : number
Returns: boolean
isMachedColorInRange(data, findRange, findValue)
isMachedColorInRange isMachedColorInRange(series color data, int findRange, color findValue)
Parameters:
data (color) : series of color
findRange (int) : int
findValue (color) : color
Returns: boolean
countMachedInRange(data, findRange, findValue)
countMachedInRange
Parameters:
data (bool) : array of numbers
findRange (int) : number
findValue (bool) : number
Returns: number
getColor(data)
getColor
Parameters:
data (float) : array of numbers
Returns: color
getColorNew(data)
getColorNew
Parameters:
data (float) : array of numbers
Returns: color
isColorBetter(color_data)
isColorBetter
Parameters:
color_data (color) : array of colors
Returns: boolean
isColorWorst(color_data)
isColorWorst
Parameters:
color_data (color) : array of colors
Returns: boolean
isColorBetter2(color_data)
isColorBetter2
Parameters:
color_data (color) : array of colors
Returns: boolean
isColorWorst2(color_data)
isColorWorst2
Parameters:
color_data (color) : array of colors
Returns: boolean
isDecreased2Bar(data)
isDecreased2Bar
Parameters:
data (float) : array of numbers
Returns: boolean
isContinuousAdvance(targetSeries, range2Find, howManyException)
isContinuousAdvance
Parameters:
targetSeries (bool) : array of booleans
range2Find (int) : number
howManyException (int) : number
Returns: boolean
isContinuous(targetSeries, range2Find, truefalse)
isContinuous
Parameters:
targetSeries (bool) : array of booleans
range2Find (int) : number
truefalse (bool) : boolean
Returns: boolean
isContinuousNotNow(targetSeries, range2Find, truefalse)
isContinuousNotNow
Parameters:
targetSeries (bool) : array of booleans
range2Find (int) : number
truefalse (bool) : boolean
Returns: boolean
isContinuousTwoFactors(targetSeries, range2Find, truefalse)
isContinuousTwoFactors
Parameters:
targetSeries (bool) : array of booleans
range2Find (int) : number
truefalse (bool) : boolean
Returns: boolean
findEventInRange(startDataBarIndex, neededDataBarIndex, currentBarIndex)
findEventInRange
Parameters:
startDataBarIndex (int) : number
neededDataBarIndex (int) : number
currentBarIndex (int) : number
Returns: boolean
findMin(firstdata, secondata, thirddata, forthdata)
findMin
Parameters:
firstdata (float) : number
secondata (float) : number
thirddata (float) : number
forthdata (float) : number
Returns: number
findMax(firstdata, secondata, thirddata, forthdata)
findMax
Parameters:
firstdata (float) : number
secondata (float) : number
thirddata (float) : number
forthdata (float) : number
Returns: number
getMA(src, length, mav)
getMA
Parameters:
src (float) : number
length (simple int) : number
mav (string) : string
Returns: number
mr(mrb_src, mrb_window, mrb_degree)
Parameters:
mrb_src (float)
mrb_window (int)
mrb_degree (int)
bpDom(maeLength, bpw, mult)
Parameters:
maeLength (int)
bpw (float)
mult (float)

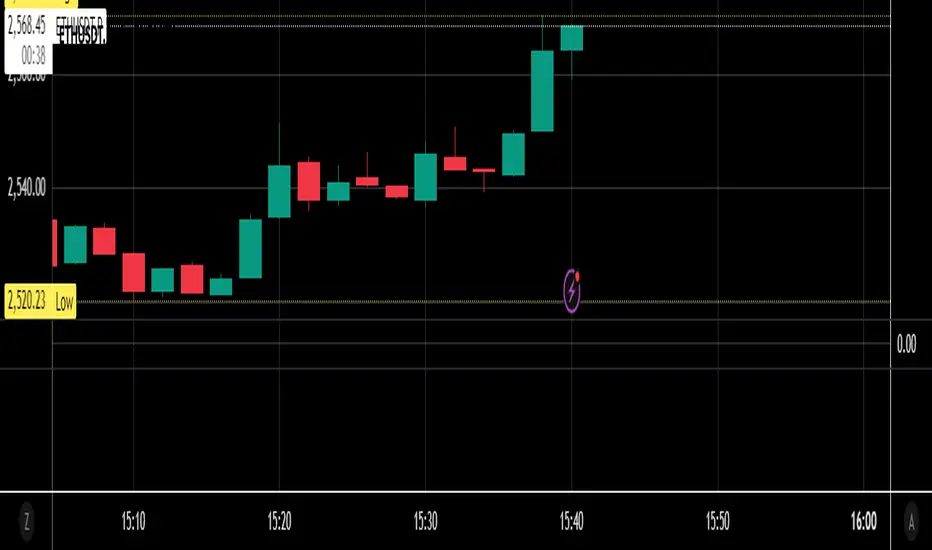
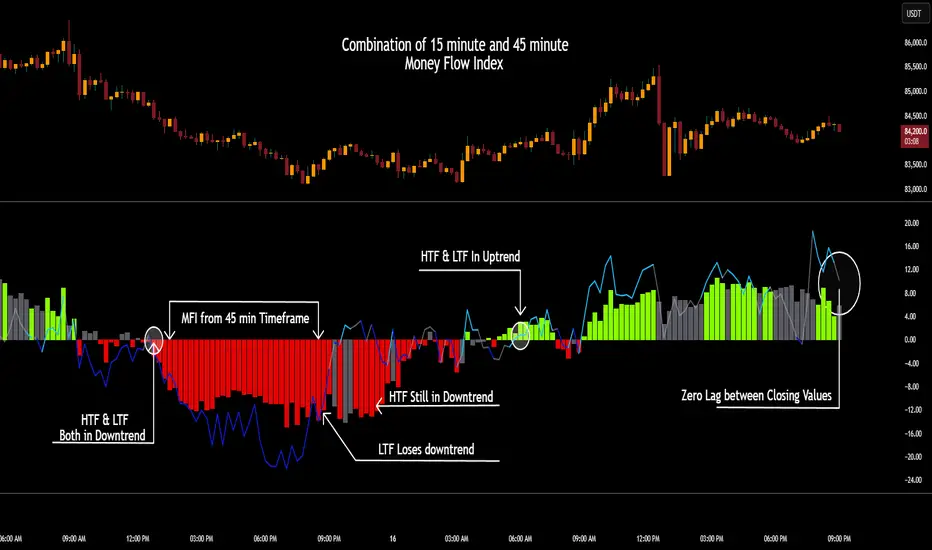
CSCMultiTimeframeToolsLibrary "CSCMultiTimeframeTools"
Calculates instant higher timeframe values for higher timeframe analysis with zero lag.
getAdjustedLookback(current_tf_minutes, higher_tf_minutes, length)
Calculate adjusted lookback period for higher timeframe conversion.
Parameters:
current_tf_minutes (int) : Current chart timeframe in minutes (e.g., 5 for 5m).
higher_tf_minutes (int) : Target higher timeframe in minutes (e.g., 15 for 15m).
length (int) : Base length value (e.g., 14 for RSI/MFI).
Returns: Adjusted lookback period (length × multiplier).
Purpose and Benefits of the TimeframeTools Library
This library is designed to solve a critical pain point for traders who rely on higher timeframe (HTF) indicator values while analyzing lower timeframe (LTF) charts. Traditional methods require waiting for multiple candles to close—for example, to see a 1-hour RSI on a 5-minute chart, you’d need 12 closed candles (5m × 12 = 60m) before the value updates. This lag means missed opportunities, delayed signals, and inefficient decision-making.
Why Traders Need This
Whether you’re scalping (5M/15M) or swing trading (1H/4H), this library bridges the gap between timeframes, giving you HTF context in real time—so you can act faster, with confidence.
How This Library Eliminates the Waiting Game
By dynamically calculating the adjusted lookback period, the library allows:
Real-time HTF values on LTF charts – No waiting for candle closes.
Accurate conversions – A 14-period RSI on a 1-hour chart translates to 168 periods (14 × 12) on a 5-minute chart, ensuring mathematical precision.
Flexible application – Works with common indicators like RSI, MFI, CCI, and moving averages (though confirmations should be done before publishing under your own secondary use).
Key Advantages Over Manual Methods
Speed: Instantly reflects HTF values without waiting for candle resolutions.
Adaptability: Adjusts automatically if the user changes timeframes or lengths.
Consistency: Removes human error in manual period calculations.
Limitations to Note
Not a magic bullet – While it solves the lag issue, traders should still:
Validate signals with price action or additional confirmations.
Be mindful of extreme lookback lengths (e.g., a 200-period daily SMA on a 1-minute chart requires 28,800 periods, which may strain performance).
PineVersatilitiesBundleLibrary "PineVersatilitiesBundle"
Versatilities (aka, Versatile Utilities) Pack includes:
- Eighteen Price Variants bundled in a Map,
- Nine Smoothing Variants bundled in a Map,
- Visualisations that indicate on both - pane and chart.
price_variants(lb)
Computes Several different averages using current and previous OHLC values
Parameters:
lb (int) : - lookback distance for combining OHLC values from the past with the present
Returns: Map of Eighteen Uncommon Combinations of single and two-bar OHLC averages (rounded-to-mintick)
dynamic_MA(masrc, malen, lsmaoff, almasgm, almaoff, almaflr)
Dynamically computes Eight different MAs and returns a Map containing Nine MAs
Parameters:
masrc (float) : source series to compute MA
malen (simple int) : lookback distance for MA
lsmaoff (simple int) : optional LSMA offset - default is 0
almasgm (simple float) : optional ALMA sigma - default is 5
almaoff (simple float) : optional ALMA offset - default is 0.5
almaflr (simple bool) : optional ALMA floor flag - default is false
Returns: Map of MAs - 'ALMA', 'EMA', 'HMA', 'LSMA', 'RMA', 'SMA', 'SWMA', 'WMA', 'ALL' (rounded-to-mintick)

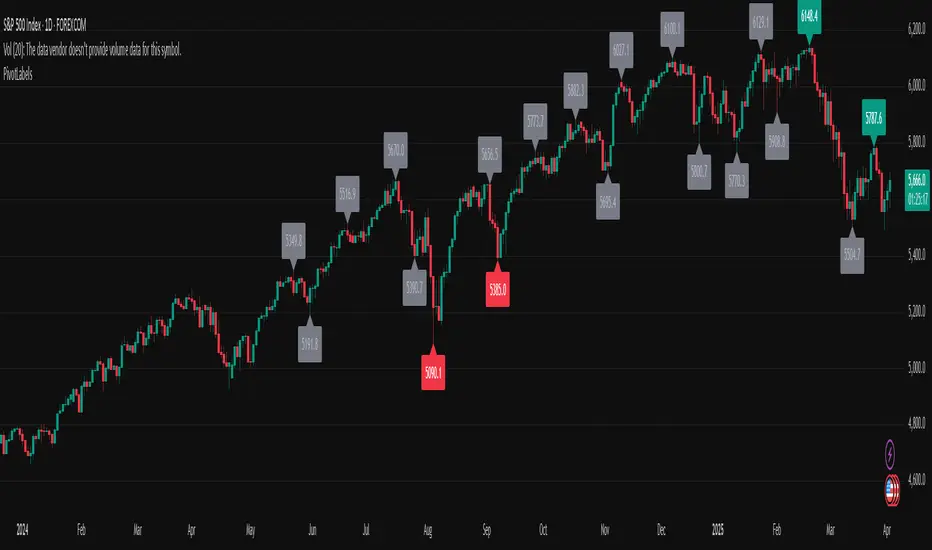
PivotLabelsLibrary "PivotLabels"
drawPivots(qtyLabels, leftLegs, rightLegs)
Displays a label for each of the last `qtyLabels` pivots.
Colors high pivots in green, low pivots in red, and breached pivots in gray.
Parameters:
qtyLabels (int) : (simple int) Quantity of last labels to display.
leftLegs (int) : (simple int) Left pivot legs.
rightLegs (int) : (simple int) Right pivot legs.
Returns: Nothing.
bollingerBandsV2Library "bollingerBandsV2"
Bollinger bands related functions
get_multiple_bollinger_bands(stdv1, stdv2, stdv3, stdv4, stdv5, stdv6, stdv7, length, source)
: Calculates 7 sets of bollinger bands, with 7 different standard deviations
Parameters:
stdv1 (float) : (simple int): standard deviation 1
stdv2 (float) : (simple int): standard deviation 2
stdv3 (float) : (simple int): standard deviation 3
stdv4 (float) : (simple int): standard deviation 4
stdv5 (float) : (simple int): standard deviation 5
stdv6 (float) : (simple int): standard deviation 6
stdv7 (float) : (simple int): standard deviation 7
length (simple int) : (simple int): Length for the bands
source (float) : (simple float): source for the calculation
Returns: : Returns 8 levels plus the range of all the levels.
get_bb_volatility(bb_highest, bb_lowest, ma_length, lookback)
: Provides a volatility indicator based on Bollinger Bands, and indicates wheather the volatility is increasing or decreasing.
Parameters:
bb_highest (float) : (simple float): Top Bollinger Band on which to calculate the range.
bb_lowest (float) : (simple float): Bottom Bollinger Band on which to calculate the range.
ma_length (simple int) : (simple int): Length to use in the smoothing of Bollinger Bands range.
lookback (int) : (simple int): Lookback period to identify a change in the Bollinger Bands range.
Returns: : Returns 8 levels plus the range of all the levels.
get_bbVolatility_data(source, length, stdv1, stdv2, stdv3, stdv4, stdv5, stdv6, stdv7, trend_direction)
: Generates Bollinger Bands Volatility
Parameters:
source (float) : (float): Source for Bollinger Bands
length (simple int) : (int): Length for Bollinger Bands
stdv1 (int) : (int): Standard Deviation 1
stdv2 (int) : (int): Standard Deviation 2
stdv3 (int) : (int): Standard Deviation 3
stdv4 (int) : (int): Standard Deviation 4
stdv5 (int) : (int): Standard Deviation 5
stdv6 (int) : (int): Standard Deviation 6
stdv7 (int) : (int): Standard Deviation 7
trend_direction (string) : (string): Current direction of the trend
Returns: : Returns a map with the levels, plus direction flag and the data table

ZigZag█ Overview
This Pine Script™ library provides a comprehensive implementation of the ZigZag indicator using advanced object-oriented programming techniques. It serves as a developer resource rather than a standalone indicator, enabling Pine Script™ programmers to incorporate sophisticated ZigZag calculations into their own scripts.
Pine Script™ libraries contain reusable code that can be imported into indicators, strategies, and other libraries. For more information, consult the Libraries section of the Pine Script™ User Manual.
█ About the Original
This library is based on TradingView's official ZigZag implementation .
The original code provides a solid foundation with user-defined types and methods for calculating ZigZag pivot points.
█ What is ZigZag?
The ZigZag indicator filters out minor price movements to highlight significant market trends.
It works by:
1. Identifying significant pivot points (local highs and lows)
2. Connecting these points with straight lines
3. Ignoring smaller price movements that fall below a specified threshold
Traders typically use ZigZag for:
- Trend confirmation
- Identifying support and resistance levels
- Pattern recognition (such as Elliott Waves)
- Filtering out market noise
The algorithm identifies pivot points by analyzing price action over a specified number of bars, then only changes direction when price movement exceeds a user-defined percentage threshold.
█ My Enhancements
This modified version extends the original library with several key improvements:
1. Support and Resistance Visualization
- Adds horizontal lines at pivot points
- Customizable line length (offset from pivot)
- Adjustable line width and color
- Option to extend lines to the right edge of the chart
2. Support and Resistance Zones
- Creates semi-transparent zone areas around pivot points
- Customizable width for better visibility of important price levels
- Separate colors for support (lows) and resistance (highs)
- Visual representation of price areas rather than just single lines
3. Zig Zag Lines
- Separate colors for upward and downward ZigZag movements
- Visually distinguishes between bullish and bearish price swings
- Customizable colors for text
- Width customization
4. Enhanced Settings Structure
- Added new fields to the Settings type to support the additional features
- Extended Pivot type with supportResistance and supportResistanceZone fields
- Comprehensive configuration options for visual elements
These enhancements make the ZigZag more useful for technical analysis by clearly highlighting support/resistance levels and zones, and providing clearer visual cues about market direction.
█ Technical Implementation
This library leverages Pine Script™'s user-defined types (UDTs) to create a robust object-oriented architecture:
- Settings : Stores configuration parameters for calculation and display
- Pivot : Represents pivot points with their visual elements and properties
- ZigZag : Manages the overall state and behavior of the indicator
The implementation follows best practices from the Pine Script™ User Manual's Style Guide and uses advanced language features like methods and object references. These UDTs represent Pine Script™'s most advanced feature set, enabling sophisticated data structures and improved code organization.
For newcomers to Pine Script™, it's recommended to understand the language fundamentals before working with the UDT implementation in this library.
█ Usage Example
//@version=6
indicator("ZigZag Example", overlay = true, shorttitle = 'ZZA', max_bars_back = 5000, max_lines_count = 500, max_labels_count = 500, max_boxes_count = 500)
import andre_007/ZigZag/1 as ZIG
var group_1 = "ZigZag Settings"
//@variable Draw Zig Zag on the chart.
bool showZigZag = input.bool(true, "Show Zig-Zag Lines", group = group_1, tooltip = "If checked, the Zig Zag will be drawn on the chart.", inline = "1")
// @variable The deviation percentage from the last local high or low required to form a new Zig Zag point.
float deviationInput = input.float(5.0, "Deviation (%)", minval = 0.00001, maxval = 100.0,
tooltip = "The minimum percentage deviation from a previous pivot point required to change the Zig Zag's direction.", group = group_1, inline = "2")
// @variable The number of bars required for pivot detection.
int depthInput = input.int(10, "Depth", minval = 1, tooltip = "The number of bars required for pivot point detection.", group = group_1, inline = "3")
// @variable registerPivot (series bool) Optional. If `true`, the function compares a detected pivot
// point's coordinates to the latest `Pivot` object's `end` chart point, then
// updates the latest `Pivot` instance or adds a new instance to the `ZigZag`
// object's `pivots` array. If `false`, it does not modify the `ZigZag` object's
// data. The default is `true`.
bool allowZigZagOnOneBarInput = input.bool(true, "Allow Zig Zag on One Bar", tooltip = "If checked, the Zig Zag calculation can register a pivot high and pivot low on the same bar.",
group = group_1, inline = "allowZigZagOnOneBar")
var group_2 = "Display Settings"
// @variable The color of the Zig Zag's lines (up).
color lineColorUpInput = input.color(color.green, "Line Colors for Up/Down", group = group_2, inline = "4")
// @variable The color of the Zig Zag's lines (down).
color lineColorDownInput = input.color(color.red, "", group = group_2, inline = "4",
tooltip = "The color of the Zig Zag's lines")
// @variable The width of the Zig Zag's lines.
int lineWidthInput = input.int(1, "Line Width", minval = 1, tooltip = "The width of the Zig Zag's lines.", group = group_2, inline = "w")
// @variable If `true`, the Zig Zag will also display a line connecting the last known pivot to the current `close`.
bool extendInput = input.bool(true, "Extend to Last Bar", tooltip = "If checked, the last pivot will be connected to the current close.",
group = group_1, inline = "5")
// @variable If `true`, the pivot labels will display their price values.
bool showPriceInput = input.bool(true, "Display Reversal Price",
tooltip = "If checked, the pivot labels will display their price values.", group = group_2, inline = "6")
// @variable If `true`, each pivot label will display the volume accumulated since the previous pivot.
bool showVolInput = input.bool(true, "Display Cumulative Volume",
tooltip = "If checked, the pivot labels will display the volume accumulated since the previous pivot.", group = group_2, inline = "7")
// @variable If `true`, each pivot label will display the change in price from the previous pivot.
bool showChgInput = input.bool(true, "Display Reversal Price Change",
tooltip = "If checked, the pivot labels will display the change in price from the previous pivot.", group = group_2, inline = "8")
// @variable Controls whether the labels show price changes as raw values or percentages when `showChgInput` is `true`.
string priceDiffInput = input.string("Absolute", "", options = ,
tooltip = "Controls whether the labels show price changes as raw values or percentages when 'Display Reversal Price Change' is checked.",
group = group_2, inline = "8")
// @variable If `true`, the Zig Zag will display support and resistance lines.
bool showSupportResistanceInput = input.bool(true, "Show Support/Resistance Lines",
tooltip = "If checked, the Zig Zag will display support and resistance lines.", group = group_2, inline = "9")
// @variable The number of bars to extend the support and resistance lines from the last pivot point.
int supportResistanceOffsetInput = input.int(50, "Support/Resistance Offset", minval = 0,
tooltip = "The number of bars to extend the support and resistance lines from the last pivot point.", group = group_2, inline = "10")
// @variable The width of the support and resistance lines.
int supportResistanceWidthInput = input.int(1, "Support/Resistance Width", minval = 1,
tooltip = "The width of the support and resistance lines.", group = group_2, inline = "11")
// @variable The color of the support lines.
color supportColorInput = input.color(color.red, "Support/Resistance Color", group = group_2, inline = "12")
// @variable The color of the resistance lines.
color resistanceColorInput = input.color(color.green, "", group = group_2, inline = "12",
tooltip = "The color of the support/resistance lines.")
// @variable If `true`, the support and resistance lines will be drawn as zones.
bool showSupportResistanceZoneInput = input.bool(true, "Show Support/Resistance Zones",
tooltip = "If checked, the support and resistance lines will be drawn as zones.", group = group_2, inline = "12-1")
// @variable The color of the support zones.
color supportZoneColorInput = input.color(color.new(color.red, 70), "Support Zone Color", group = group_2, inline = "12-2")
// @variable The color of the resistance zones.
color resistanceZoneColorInput = input.color(color.new(color.green, 70), "", group = group_2, inline = "12-2",
tooltip = "The color of the support/resistance zones.")
// @variable The width of the support and resistance zones.
int supportResistanceZoneWidthInput = input.int(10, "Support/Resistance Zone Width", minval = 1,
tooltip = "The width of the support and resistance zones.", group = group_2, inline = "12-3")
// @variable If `true`, the support and resistance lines will extend to the right of the chart.
bool supportResistanceExtendInput = input.bool(false, "Extend to Right",
tooltip = "If checked, the lines will extend to the right of the chart.", group = group_2, inline = "13")
// @variable References a `Settings` instance that defines the `ZigZag` object's calculation and display properties.
var ZIG.Settings settings =
ZIG.Settings.new(
devThreshold = deviationInput,
depth = depthInput,
lineColorUp = lineColorUpInput,
lineColorDown = lineColorDownInput,
textUpColor = lineColorUpInput,
textDownColor = lineColorDownInput,
lineWidth = lineWidthInput,
extendLast = extendInput,
displayReversalPrice = showPriceInput,
displayCumulativeVolume = showVolInput,
displayReversalPriceChange = showChgInput,
differencePriceMode = priceDiffInput,
draw = showZigZag,
allowZigZagOnOneBar = allowZigZagOnOneBarInput,
drawSupportResistance = showSupportResistanceInput,
supportResistanceOffset = supportResistanceOffsetInput,
supportResistanceWidth = supportResistanceWidthInput,
supportColor = supportColorInput,
resistanceColor = resistanceColorInput,
supportResistanceExtend = supportResistanceExtendInput,
supportResistanceZoneWidth = supportResistanceZoneWidthInput,
drawSupportResistanceZone = showSupportResistanceZoneInput,
supportZoneColor = supportZoneColorInput,
resistanceZoneColor = resistanceZoneColorInput
)
// @variable References a `ZigZag` object created using the `settings`.
var ZIG.ZigZag zigZag = ZIG.newInstance(settings)
// Update the `zigZag` on every bar.
zigZag.update()
//#endregion
The example code demonstrates how to create a ZigZag indicator with customizable settings. It:
1. Creates a Settings object with user-defined parameters
2. Instantiates a ZigZag object using these settings
3. Updates the ZigZag on each bar to detect new pivot points
4. Automatically draws lines and labels when pivots are detected
This approach provides maximum flexibility while maintaining readability and ease of use.

LinearRegressionLibrary "LinearRegression"
Calculates a variety of linear regression and deviation types, with optional emphasis weighting. Additionally, multiple of slope and Pearson’s R calculations.
calcSlope(_src, _len, _condition)
Calculates the slope of a linear regression over the specified length.
Parameters:
_src (float) : (float) The source data.
_len (int) : (int) The length of the lookback period for the linear regression.
_condition (bool) : (bool) Flag to enable calculation. Set to true to calculate on every bar; otherwise, set to barstate.islast for efficiency.
Returns: (float) The slope of the linear regression.
calcReg(_src, _len, _condition)
Calculates a basic linear regression, returning y1, y2, slope, and average.
Parameters:
_src (float) : (float) The source data series.
_len (int) : (int) The length of the lookback period.
_condition (bool) : (bool) Flag to enable calculation (true = calculate).
Returns: (float ) An array of 4 values: .
calcRegStandard(_src, _len, _emphasis, _condition)
Calculates an Standard linear regression with optional emphasis.
Parameters:
_src (float) : (series float) The source data series.
_len (int) : (int) The length of the lookback period.
_emphasis (float) : (float) The emphasis factor: 0 for equal weight; >0 emphasizes recent bars; <0 emphasizes older bars.
_condition (bool) : (bool) Flag to enable calculation (true = calculate).
Returns: (float ) .
calcRegRidge(_src, _len, lambda, _emphasis, _condition)
Calculates a ridge regression with optional emphasis.
Parameters:
_src (float) : (float) The source data series.
_len (int) : (int) The length of the lookback period.
lambda (float) : (float) The ridge regularization parameter.
_emphasis (float) : (float) The emphasis factor: 0 for equal weight; >0 emphasizes recent bars; <0 emphasizes older bars.
_condition (bool) : (bool) Flag to enable calculation (true = calculate).
Returns: (float ) .
calcRegLasso(_src, _len, lambda, _emphasis, _condition)
Calculates a Lasso regression with optional emphasis.
Parameters:
_src (float) : (float) The source data series.
_len (int) : (int) The length of the lookback period.
lambda (float) : (float) The Lasso regularization parameter.
_emphasis (float) : (float) The emphasis factor: 0 for equal weight; >0 emphasizes recent bars; <0 emphasizes older bars.
_condition (bool) : (bool) Flag to enable calculation (true = calculate).
Returns: (float ) .
calcElasticNetLinReg(_src, _len, lambda1, lambda2, _emphasis, _condition)
Calculates an Elastic Net regression with optional emphasis.
Parameters:
_src (float) : (float) The source data series.
_len (int) : (int) The length of the lookback period.
lambda1 (float) : (float) L1 regularization parameter (Lasso).
lambda2 (float) : (float) L2 regularization parameter (Ridge).
_emphasis (float) : (float) Emphasis factor: 0 for equal weight; >0 emphasizes recent bars; <0 emphasizes older bars.
_condition (bool) : (bool) Flag to enable calculation (true = calculate).
Returns: (float ) .
calcRegHuber(_src, _len, delta, iterations, _emphasis, _condition)
Calculates a Huber regression using Iteratively Reweighted Least Squares (IRLS).
Parameters:
_src (float) : (float) The source data series.
_len (int) : (int) The length of the lookback period.
delta (float) : (float) Huber threshold parameter.
iterations (int) : (int) Number of IRLS iterations.
_emphasis (float) : (float) Emphasis factor: 0 for equal weight; >0 emphasizes recent bars; <0 emphasizes older bars.
_condition (bool) : (bool) Flag to enable calculation (true = calculate).
Returns: (float ) .
calcRegLAD(_src, _len, iterations, _emphasis, _condition)
Calculates a Least Absolute Deviations (LAD) regression via IRLS.
Parameters:
_src (float) : (float) The source data series.
_len (int) : (int) The length of the lookback period.
iterations (int) : (int) Number of IRLS iterations for LAD.
_emphasis (float) : (float) Emphasis factor: 0 for equal weight; >0 emphasizes recent bars; <0 emphasizes older bars.
_condition (bool) : (bool) Flag to enable calculation (true = calculate).
Returns: (float ) .
calcRegBayesian(_src, _len, priorMean, priorSpan, sigma, _emphasis, _condition)
Calculates a Bayesian linear regression with optional emphasis.
Parameters:
_src (float) : (float) The source data series.
_len (int) : (int) The length of the lookback period.
priorMean (float) : (float) The prior mean for the slope.
priorSpan (float) : (float) The prior variance (or span) for the slope.
sigma (float) : (float) The assumed standard deviation of residuals.
_emphasis (float) : (float) Emphasis factor: 0 for equal weight; >0 emphasizes recent bars; <0 emphasizes older bars.
_condition (bool) : (bool) Flag to enable calculation (true = calculate).
Returns: (float ) .
calcRFromLinReg(_src, _len, _slope, _average, _y1, _condition)
Calculates the Pearson correlation coefficient (R) based on linear regression parameters.
Parameters:
_src (float) : (float) The source data.
_len (int) : (int) The length of the lookback period.
_slope (float) : (float) The slope of the linear regression.
_average (float) : (float) The average value of the source data series.
_y1 (float) : (float) The starting point (y-intercept of the oldest bar) for the linear regression.
_condition (bool) : (bool) Flag to enable calculation. Set to true to calculate on every bar; otherwise, set to barstate.islast for efficiency.
Returns: (float) The Pearson correlation coefficient (R) adjusted for the direction of the slope.
calcRFromSource(_src, _len, _condition)
Calculates the correlation coefficient (R) using a specified length and source data.
Parameters:
_src (float) : (float) The source data.
_len (int) : (int) The length of the lookback period.
_condition (bool) : (bool) Flag to enable calculation. Set to true to calculate on every bar; otherwise, set to barstate.islast for efficiency.
Returns: (float) The correlation coefficient (R).
calcSlopeLengthZero(_src, _len, _minLen, _step, _condition)
Identifies the length at which the slope is flattest (closest to zero).
Parameters:
_src (float) : (float) The source data.
_len (int) : (int) The maximum lookback length to consider (minimum of 2).
_minLen (int) : (int) The minimum length to start from (cannot exceed the max length).
_step (int) : (int) The increment step for lengths.
_condition (bool) : (bool) Flag to enable calculation. Set to true to calculate on every bar; otherwise, set to barstate.islast.
Returns: (int) The length at which the slope is flattest.
calcSlopeLengthHighest(_src, _len, _minLen, _step, _condition)
Identifies the length at which the slope is highest.
Parameters:
_src (float) : (float) The source data.
_len (int) : (int) The maximum lookback length (minimum of 2).
_minLen (int) : (int) The minimum length to start from.
_step (int) : (int) The step for incrementing lengths.
_condition (bool) : (bool) Flag to enable calculation. Set to true to calculate on every bar; otherwise, set to barstate.islast.
Returns: (int) The length at which the slope is highest.
calcSlopeLengthLowest(_src, _len, _minLen, _step, _condition)
Identifies the length at which the slope is lowest.
Parameters:
_src (float) : (float) The source data.
_len (int) : (int) The maximum lookback length (minimum of 2).
_minLen (int) : (int) The minimum length to start from.
_step (int) : (int) The step for incrementing lengths.
_condition (bool) : (bool) Flag to enable calculation. Set to true to calculate on every bar; otherwise, set to barstate.islast.
Returns: (int) The length at which the slope is lowest.
calcSlopeLengthAbsolute(_src, _len, _minLen, _step, _condition)
Identifies the length at which the absolute slope value is highest.
Parameters:
_src (float) : (float) The source data.
_len (int) : (int) The maximum lookback length (minimum of 2).
_minLen (int) : (int) The minimum length to start from.
_step (int) : (int) The step for incrementing lengths.
_condition (bool) : (bool) Flag to enable calculation. Set to true to calculate on every bar; otherwise, set to barstate.islast.
Returns: (int) The length at which the absolute slope value is highest.
calcRLengthZero(_src, _len, _minLen, _step, _condition)
Identifies the length with the lowest absolute R value.
Parameters:
_src (float) : (float) The source data.
_len (int) : (int) The maximum lookback length (minimum of 2).
_minLen (int) : (int) The minimum length to start from.
_step (int) : (int) The step for incrementing lengths.
_condition (bool) : (bool) Flag to enable calculation. Set to true to calculate on every bar; otherwise, set to barstate.islast.
Returns: (int) The length with the lowest absolute R value.
calcRLengthHighest(_src, _len, _minLen, _step, _condition)
Identifies the length with the highest R value.
Parameters:
_src (float) : (float) The source data.
_len (int) : (int) The maximum lookback length (minimum of 2).
_minLen (int) : (int) The minimum length to start from.
_step (int) : (int) The step for incrementing lengths.
_condition (bool) : (bool) Flag to enable calculation. Set to true to calculate on every bar; otherwise, set to barstate.islast.
Returns: (int) The length with the highest R value.
calcRLengthLowest(_src, _len, _minLen, _step, _condition)
Identifies the length with the lowest R value.
Parameters:
_src (float) : (float) The source data.
_len (int) : (int) The maximum lookback length (minimum of 2).
_minLen (int) : (int) The minimum length to start from.
_step (int) : (int) The step for incrementing lengths.
_condition (bool) : (bool) Flag to enable calculation. Set to true to calculate on every bar; otherwise, set to barstate.islast.
Returns: (int) The length with the lowest R value.
calcRLengthAbsolute(_src, _len, _minLen, _step, _condition)
Identifies the length with the highest absolute R value.
Parameters:
_src (float) : (float) The source data.
_len (int) : (int) The maximum lookback length (minimum of 2).
_minLen (int) : (int) The minimum length to start from.
_step (int) : (int) The step for incrementing lengths.
_condition (bool) : (bool) Flag to enable calculation. Set to true to calculate on every bar; otherwise, set to barstate.islast.
Returns: (int) The length with the highest absolute R value.
calcDevReverse(_src, _len, _slope, _y1, _inputDev, _emphasis, _condition)
Calculates the regressive linear deviation in reverse order, with optional emphasis on recent data.
Parameters:
_src (float) : (float) The source data.
_len (int) : (int) The length of the lookback period.
_slope (float) : (float) The slope of the linear regression.
_y1 (float) : (float) The y-intercept (oldest bar) of the linear regression.
_inputDev (float) : (float) The input deviation multiplier.
_emphasis (float) : (float) Emphasis factor: 0 for equal weight; >0 emphasizes recent bars; <0 emphasizes older bars.
_condition (bool) : (bool) Flag to enable calculation (true = calculate).
Returns: A 2-element tuple: .
calcDevForward(_src, _len, _slope, _y1, _inputDev, _emphasis, _condition)
Calculates the progressive linear deviation in forward order (oldest to most recent bar), with optional emphasis.
Parameters:
_src (float) : (float) The source data array, where _src is oldest and _src is most recent.
_len (int) : (int) The length of the lookback period.
_slope (float) : (float) The slope of the linear regression.
_y1 (float) : (float) The y-intercept of the linear regression (value at the most recent bar, adjusted by slope).
_inputDev (float) : (float) The input deviation multiplier.
_emphasis (float) : (float) Emphasis factor: 0 for equal weight; >0 emphasizes recent bars; <0 emphasizes older bars.
_condition (bool) : (bool) Flag to enable calculation (true = calculate).
Returns: A 2-element tuple: .
calcDevBalanced(_src, _len, _slope, _y1, _inputDev, _emphasis, _condition)
Calculates the balanced linear deviation with optional emphasis on recent or older data.
Parameters:
_src (float) : (float) Source data array, where _src is the most recent and _src is the oldest.
_len (int) : (int) The length of the lookback period.
_slope (float) : (float) The slope of the linear regression.
_y1 (float) : (float) The y-intercept of the linear regression (value at the oldest bar).
_inputDev (float) : (float) The input deviation multiplier.
_emphasis (float) : (float) Emphasis factor: 0 for equal weight; >0 emphasizes recent bars; <0 emphasizes older bars.
_condition (bool) : (bool) Flag to enable calculation (true = calculate).
Returns: A 2-element tuple: .
calcDevMean(_src, _len, _slope, _y1, _inputDev, _emphasis, _condition)
Calculates the mean absolute deviation from a forward-applied linear trend (oldest to most recent), with optional emphasis.
Parameters:
_src (float) : (float) The source data array, where _src is the most recent and _src is the oldest.
_len (int) : (int) The length of the lookback period.
_slope (float) : (float) The slope of the linear regression.
_y1 (float) : (float) The y-intercept (oldest bar) of the linear regression.
_inputDev (float) : (float) The input deviation multiplier.
_emphasis (float) : (float) Emphasis factor: 0 for equal weight; >0 emphasizes recent bars; <0 emphasizes older bars.
_condition (bool) : (bool) Flag to enable calculation (true = calculate).
Returns: A 2-element tuple: .
calcDevMedian(_src, _len, _slope, _y1, _inputDev, _emphasis, _condition)
Calculates the median absolute deviation with optional emphasis on recent data.
Parameters:
_src (float) : (float) The source data array (index 0 = oldest, index _len - 1 = most recent).
_len (int) : (int) The length of the lookback period.
_slope (float) : (float) The slope of the linear regression.
_y1 (float) : (float) The y-intercept (oldest bar) of the linear regression.
_inputDev (float) : (float) The deviation multiplier.
_emphasis (float) : (float) Emphasis factor: 0 for equal weight; >0 emphasizes recent bars; <0 emphasizes older bars.
_condition (bool) : (bool) Flag to enable calculation (true = calculate).
Returns:
calcDevPercent(_y1, _inputDev, _condition)
Calculates the percent deviation from a given value and a specified percentage.
Parameters:
_y1 (float) : (float) The base value from which to calculate deviation.
_inputDev (float) : (float) The deviation percentage.
_condition (bool) : (bool) Flag to enable calculation (true = calculate).
Returns: A 2-element tuple: .
calcDevFitted(_len, _slope, _y1, _emphasis, _condition)
Calculates the weighted fitted deviation based on high and low series data, showing max deviation, with optional emphasis.
Parameters:
_len (int) : (int) The length of the lookback period.
_slope (float) : (float) The slope of the linear regression.
_y1 (float) : (float) The Y-intercept (oldest bar) of the linear regression.
_emphasis (float) : (float) Emphasis factor: 0 for equal weight; >0 emphasizes recent bars; <0 emphasizes older bars.
_condition (bool) : (bool) Flag to enable calculation (true = calculate).
Returns: A 2-element tuple: .
calcDevATR(_src, _len, _slope, _y1, _inputDev, _emphasis, _condition)
Calculates an ATR-style deviation with optional emphasis on recent data.
Parameters:
_src (float) : (float) The source data (typically close).
_len (int) : (int) The length of the lookback period.
_slope (float) : (float) The slope of the linear regression.
_y1 (float) : (float) The Y-intercept (oldest bar) of the linear regression.
_inputDev (float) : (float) The input deviation multiplier.
_emphasis (float) : (float) Emphasis factor: 0 for equal weight; >0 emphasizes recent bars; <0 emphasizes older bars.
_condition (bool) : (bool) Flag to enable calculation (true = calculate).
Returns: A 2-element tuple: .
calcPricePositionPercent(_top, _bot, _src)
Calculates the percent position of a price within a linear regression channel. Top=100%, Bottom=0%.
Parameters:
_top (float) : (float) The top (positive) deviation, corresponding to 100%.
_bot (float) : (float) The bottom (negative) deviation, corresponding to 0%.
_src (float) : (float) The source price.
Returns: (float) The percent position within the channel.
plotLinReg(_len, _y1, _y2, _slope, _devTop, _devBot, _scaleTypeLog, _lineWidth, _extendLines, _channelStyle, _colorFill, _colUpLine, _colDnLine, _colUpFill, _colDnFill)
Plots the linear regression line and its deviations, with configurable styles and fill.
Parameters:
_len (int) : (int) The lookback period for the linear regression.
_y1 (float) : (float) The starting y-value of the regression line.
_y2 (float) : (float) The ending y-value of the regression line.
_slope (float) : (float) The slope of the regression line (used to determine line color).
_devTop (float) : (float) The top deviation to add to the line.
_devBot (float) : (float) The bottom deviation to subtract from the line.
_scaleTypeLog (bool) : (bool) Use a log scale if true; otherwise, linear scale.
_lineWidth (int) : (int) The width of the plotted lines.
_extendLines (string) : (string) How lines should extend (none, left, right, both).
_channelStyle (string) : (string) The style of the channel lines (solid, dashed, dotted).
_colorFill (bool) : (bool) Whether to fill the space between the top and bottom deviation lines.
_colUpLine (color) : (color) Line color when slope is positive.
_colDnLine (color) : (color) Line color when slope is negative.
_colUpFill (color) : (color) Fill color when slope is positive.
_colDnFill (color) : (color) Fill color when slope is negative.

ootaLibrary "oota"
Collection of all custom and enhanced TA indicators - Object oriented methods implementation
method tr(c, useTrueRange)
returns true range of the candle
Namespace types: Candle
Parameters:
c (Candle) : Candle object containing ohlc data
useTrueRange (bool) : Use true range for atr calculation instead of just high/low difference
method ma(maType, length, source)
returns custom moving averages
Namespace types: simple CustomSeries
Parameters:
maType (simple CustomSeries) : Custom series type
length (simple int) : Moving Average Length
source (float) : Moving Average Source
Returns: moving average for the given type and length
method atr(maType, length, useTrueRange, c)
returns ATR with custom moving average
Namespace types: simple CustomSeries
Parameters:
maType (simple CustomSeries) : Custom series type
length (simple int) : Moving Average Length
useTrueRange (bool) : Use true range for atr calculation instead of just high/low difference
c (Candle) : Candle object containing ohlc
Returns: ATR for the given moving average type and length
method atrpercent(maType, length, useTrueRange, c)
returns ATR as percentage of close price
Namespace types: simple CustomSeries
Parameters:
maType (simple CustomSeries) : Custom series type
length (simple int) : Moving Average Length
useTrueRange (bool) : Use true range for atr calculation instead of just high/low difference
c (Candle) : Candle object containing ohlc
Returns: ATR as percentage of close price for the given moving average type and length
method bb(maType, length, multiplier, sticky, c)
returns Bollinger band for custom moving average
Namespace types: simple CustomSeries
Parameters:
maType (simple CustomSeries) : Custom series type
length (simple int) : Moving Average Length
multiplier (float) : Standard Deviation multiplier
sticky (simple bool) : - sticky boundaries which will only change when value is outside boundary.
c (Candle) : Candle object containing ohlc
Returns: Bollinger band with custom moving average for given source, length and multiplier
method bbw(maType, length, multiplier, sticky, c)
returns Bollinger bandwidth for custom moving average
Namespace types: simple CustomSeries
Parameters:
maType (simple CustomSeries) : Custom series type
length (simple int) : Moving Average Length
multiplier (float) : Standard Deviation multiplier
sticky (simple bool) : sticky boundaries which will only change when value is outside boundary.
c (Candle) : Candle object containing ohlc
Returns: Bollinger Bandwidth for custom moving average for given source, length and multiplier
method bpercentb(maType, length, multiplier, sticky, c)
returns Bollinger Percent B for custom moving average
Namespace types: simple CustomSeries
Parameters:
maType (simple CustomSeries) : Custom series type
length (simple int) : Moving Average Length
multiplier (float) : Standard Deviation multiplier
sticky (simple bool) : - sticky boundaries which will only change when value is outside boundary.
c (Candle) : Candle object containing ohlc
Returns: Bollinger Percent B for custom moving average for given source, length and multiplier
method kc(maType, length, multiplier, useTrueRange, sticky, c)
returns Keltner Channel for custom moving average
Namespace types: simple CustomSeries
Parameters:
maType (simple CustomSeries) : Custom series type
length (simple int) : Moving Average Length
multiplier (float) : Standard Deviation multiplier
useTrueRange (simple bool) : - if set to false, uses high-low.
sticky (simple bool) : - sticky boundaries which will only change when value is outside boundary.
c (Candle) : Candle object containing ohlc
Returns: Keltner Channel for custom moving average for given souce, length and multiplier
method kcw(maType, length, multiplier, useTrueRange, sticky, c)
returns Keltner Channel Width with custom moving average
Namespace types: simple CustomSeries
Parameters:
maType (simple CustomSeries) : Custom series type
length (simple int) : Moving Average Length
multiplier (float) : Standard Deviation multiplier
useTrueRange (simple bool) : - if set to false, uses high-low.
sticky (simple bool) : - sticky boundaries which will only change when value is outside boundary.
c (Candle) : Candle object containing ohlc
Returns: Keltner Channel Width for custom moving average
method kpercentk(maType, length, multiplier, useTrueRange, sticky, c)
returns Keltner Channel Percent K Width with custom moving average
Namespace types: simple CustomSeries
Parameters:
maType (simple CustomSeries) : Custom series type
length (simple int) : Moving Average Length
multiplier (float) : Standard Deviation multiplier
useTrueRange (simple bool) : - if set to false, uses high-low.
sticky (simple bool) : - sticky boundaries which will only change when value is outside boundary.
c (Candle) : Candle object containing ohlc
Returns: Keltner Percent K for given moving average, source, length and multiplier
method dc(c, length, sticky)
returns Custom Donchian Channel
Namespace types: Candle
Parameters:
c (Candle) : Candle object containing ohlc
length (simple int) : - donchian channel length
sticky (simple bool) : - sticky boundaries which will only change when value is outside boundary.
Returns: Donchian channel
method dcw(c, length, sticky)
returns Donchian Channel Width
Namespace types: Candle
Parameters:
c (Candle) : Candle object containing ohlc
length (simple int) : - donchian channel length
sticky (simple bool) : - sticky boundaries which will only change when value is outside boundary.
Returns: Donchian channel width
method dpercentd(c, length, sticky)
returns Donchian Channel Percent of price
Namespace types: Candle
Parameters:
c (Candle) : Candle object containing ohlc
length (simple int) : - donchian channel length
sticky (simple bool) : - sticky boundaries which will only change when value is outside boundary.
Returns: Donchian channel Percent D
method supertrend(maType, length, multiplier, useTrueRange, waitForClose, delayed, c)
supertrend Simple supertrend based on atr but also takes into consideration of custom MA Type, sources
Namespace types: simple CustomSeries
Parameters:
maType (simple CustomSeries) : Custom Series
length (simple int) : ATR Length
multiplier (simple float) : ATR Multiplier
useTrueRange (simple bool) : - if set to false, uses high-low.
waitForClose (simple bool) : : Considers source for direction change crossover if checked. Else, uses highSource and lowSource.
delayed (simple bool) : : if set to true lags supertrend atr stop based on target levels.
c (Candle) : Candle object containing ohlc
Returns: dir : Supertrend direction
supertrend : BuyStop if direction is 1 else SellStop
method oscillatorRange(seriesType, source, highlowLength, rangeLength, sticky)
oscillatorRange - returns Custom overbought/oversold areas for an oscillator input
Namespace types: simple CustomSeries
Parameters:
seriesType (simple CustomSeries) : - Custom series type
source (float) : - Osillator source such as RSI, COG etc.
highlowLength (simple int) : - length on which highlow of the oscillator is calculated
rangeLength (simple int) : - length used for calculating oversold/overbought range - usually same as oscillator length
sticky (simple bool) : - overbought, oversold levels won't change unless crossed
Returns: Dynamic overbought and oversold range for oscillator input
method oscillator(oscillatorType, length, shortLength, longLength, c)
oscillator - returns Choice of oscillator with custom overbought/oversold range
Namespace types: simple OscillatorType
Parameters:
oscillatorType (simple OscillatorType) : OscillatorType object
length (simple int) : - Oscillator length - not used for TSI
shortLength (simple int) : - shortLength only used for TSI
longLength (simple int) : - longLength only used for TSI
c (Candle) : Candle object containing ohlc
Returns: Oscillator value
method oscillatorWithRange(oscillatorType, length, shortLength, longLength, seriesType, highlowLength, sticky, c)
oscillatorWithRange - returns Choice of oscillator with custom overbought/oversold range
Namespace types: simple OscillatorType
Parameters:
oscillatorType (simple OscillatorType) : OscillatorType object
length (simple int) : - Oscillator length - not used for TSI
shortLength (simple int) : - shortLength only used for TSI
longLength (simple int) : - longLength only used for TSI
seriesType (simple CustomSeries) : - CustomSeries enum type
highlowLength (simple int) : - length on which highlow of the oscillator is calculated
sticky (simple bool) : - overbought, oversold levels won't change unless crossed
c (Candle) : Candle object containing ohlc
Returns: Oscillator value along with dynamic overbought and oversold range for oscillator input
Candle
Custom candle object
Fields:
o (series float) : open
h (series float) : high
l (series float) : low
c (series float) : close
barindex (series int) : bar_index
bartime (series int) : time
bartimeclose (series int) : time_close
v (series float) : volume
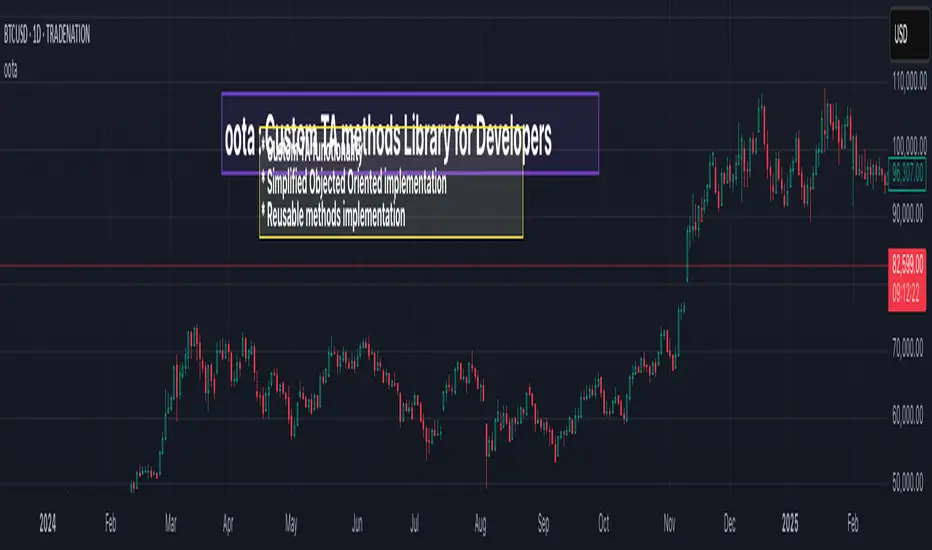
regressionUtilitiesLibrary "regressionUtilities"
get_linear_regression(bar_index_array, prices_array, stdDev_mult)
: Generates the linear regression channel for an array of values.
Parameters:
bar_index_array (array) : (array): Array with bar indexes
prices_array (array) : (array): Array with prices
stdDev_mult (float) : (float): Standard deviation multiple for the channels
Returns: : Returns x1, x2, y1_mid, y2_mid, y1_up, y2_up, y1_dn, y2_dn, m, b, R2, stdDev
get_optimal_linearRegression_channel(max_length, min_length, source, stdDev_mult, show_data_table, tableYpos, tableXpos, table_textSize, barsToRight, plot_labels, include_levels)
: Gets the best fitting linear regression using optimum length
Parameters:
max_length (int) : (int): Maximum bar length
min_length (int) : (int): Minimum bar length
source (float) : (float): Source for the regression
stdDev_mult (float) : (float): Array with prices
show_data_table (bool) : (bool): Activates and shows the data table
tableYpos (string)
tableXpos (string)
table_textSize (string)
barsToRight (int)
plot_labels (bool)
include_levels (bool)
Returns: : Returns three line objects that conform the regression channel, plus the optimal length and maximum r2
get_regressionChannel_data(max_length, min_length, source, stdDev_mult, plot_linearRegression, plot_labels, include_levels, barsToRight)
: Gets data for the linear regression channel
Parameters:
max_length (int) : (int): Maximum length for the linear regression.
min_length (int) : (int): Minimum length for the linear regression.
source (float) : (float): Source for the linear regression
stdDev_mult (float) : (float): Multiple for the standar deviations for the linear regression channel.
plot_linearRegression (bool)
plot_labels (bool)
include_levels (bool)
barsToRight (int)
Returns: : Returns a maps with the regression levels, the direction flag and the datatable map.
get_regressionChannel_data_v2(max_length, min_length, source, stdDev_mult, plot_linearRegression, plot_labels, include_levels, barsToRight)
Parameters:
max_length (int)
min_length (int)
source (float)
stdDev_mult (float)
plot_linearRegression (bool)
plot_labels (bool)
include_levels (bool)
barsToRight (int)
get_cuadratic_regression(x_array, y_array, bars_to_project, max_length)
: Gets the best fitting linear regression using optimum length
Parameters:
x_array (array) : (array): Maximum bar length
y_array (array) : (array): Minimum bar length
bars_to_project (int) : (int): Array with prices
max_length (int)
Returns: : Returns three line objects
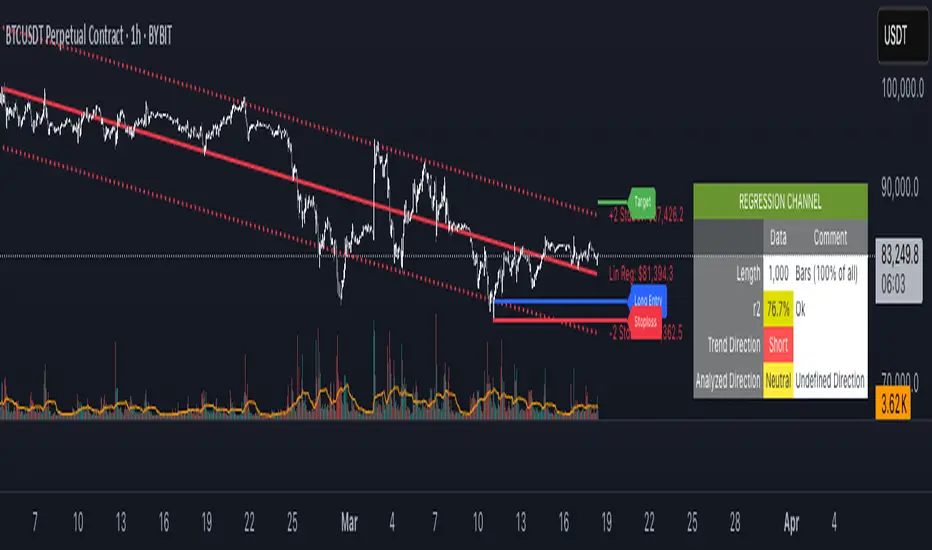
rate_of_changeLibrary "rate_of_change"
// @description: Applies ROC algorithm to any pair of values.
// This library function is used to scale change of value (price, volume) to a percentage value, just as the ROC indicator would do. It is good practice to scale arbitrary ranges to set boundaries when you try to train statistical model.
rateOfChange(value, base, hardlimit)
This function is a helper to scale a value change to its percentage value.
Parameters:
value (float)
base (float)
hardlimit (int)
Returns: per: A float comprised between 0 and 100

TALibrary "TA"
Technical analysis library that provides convenience functions and overrides for tradingview's own ta.* functions in order to work around various limitations.
sma(src, length)
Override for ta.sma that allows you to provide series values
Parameters:
src (float) : The source values to process
length (int) : The length of the source to evaluate for the moving average
Returns: float The moving average
ema(src, length)
Override for ta.ema that allows you to provide series values
Parameters:
src (float) : The source values to process
length (int) : The length of the source to evaluate for the moving average
Returns: float The moving average
rma(src, length)
Override for ta.rma that allows you to provide series values
Parameters:
src (float) : The source values to process
length (int) : The length of the source to evaluate for the moving average
Returns: float The moving average
wma(src, length)
Override for ta.wma that allows you to provide series values
Parameters:
src (float) : The source values to process
length (int) : The length of the source to evaluate for the moving average
Returns: float The moving average
vwma(src, length)
Override for ta.vwma that allows you to provide series values
Parameters:
src (float) : The source values to process
length (int) : The length of the source to evaluate for the moving average
Returns: float The moving average
ma(src, length, maType)
Provide the requested moving average
Parameters:
src (float) : The source values to process
length (int) : The length of the source to evaluate for the moving average
maType (string) : The type of moving average to return: SMA (default), EMA, SMMA (RMA), WMA, VWMA
Returns: float The moving average
Cometreon_Public📚 Cometreon Public Library – Advanced Functions for Pine Script
This library contains advanced functions used in my public indicators on TradingView. The goal is to make the code more modular and efficient, allowing users to call pre-built functions for complex calculations without rewriting them from scratch.
🔹 Currently Available Functions:
1️⃣ Moving Average Function – Provides multiple types of moving averages to choose from, including:
SMA (Simple Moving Average)
EMA (Exponential Moving Average)
WMA (Weighted Moving Average)
RMA (Smoothed Moving Average)
HMA (Hull Moving Average)
JMA (Jurik Moving Average)
DEMA (Double Exponential Moving Average)
TEMA (Triple Exponential Moving Average)
LSMA (Least Squares Moving Average)
VWMA (Volume-Weighted Moving Average)
SMMA (Smoothed Moving Average)
KAMA (Kaufman’s Adaptive Moving Average)
ALMA (Arnaud Legoux Moving Average)
FRAMA (Fractal Adaptive Moving Average)
VIDYA (Variable Index Dynamic Average)
2️⃣ Custom RSI – Uses the Moving Average function to modify the calculation method, with an additional option for a dynamic version.
3️⃣ Custom MACD – Uses the Moving Average function to modify the calculation method, with an additional option for a dynamic version.
4️⃣ Custom Alligator – Uses the Moving Average function to modify generic calculations, allowing users to change the calculation method.

TCTDailyBiasLibraryLibrary "TCTDailyBiasLibrary"
Provides a simple function to return a daily bias based on the break of the morning range
getDailyBias()
Returns the daily bias based on the break of the morning range
Returns: bias

DynamicMALibrary "DynamicMA"
Dynamic Moving Averages Library
Introduction
The Dynamic Moving Averages Library is a specialized collection of custom built functions designed to calculate moving averages dynamically, beginning from the first available bar. Unlike standard moving averages, which rely on fixed length lookbacks, this library ensures that indicators remain fully functional from the very first data point, making it an essential tool for analysing assets with short time series or limited historical data.
This approach allows traders and developers to build robust indicators that do not require a preset amount of historical data before generating meaningful outputs. It is particularly advantageous for:
Newly listed assets with minimal price history.
High-timeframe trading, where large lookback periods can lead to delayed or missing data.
By eliminating the constraints of fixed lookback periods, this library enables the seamless construction of trend indicators, smoothing functions, and hybrid models that adapt instantly to market conditions.
Comprehensive Set of Custom Moving Averages
The library includes a wide range of custom dynamic moving averages, each designed for specific analytical use cases:
SMA (Simple Moving Average) – The fundamental moving average, dynamically computed.
EMA (Exponential Moving Average) – Adaptive smoothing for better trend tracking.
DEMA (Double Exponential Moving Average) – Faster trend detection with reduced lag.
TEMA (Triple Exponential Moving Average) – Even more responsive than DEMA.
WMA (Weighted Moving Average) – Emphasizes recent price action while reducing noise.
VWMA (Volume Weighted Moving Average) – Accounts for volume to give more weight to high-volume periods.
HMA (Hull Moving Average) – A superior smoothing method with low lag.
SMMA (Smoothed Moving Average) – A hybrid approach between SMA and EMA.
LSMA (Least Squares Moving Average) – Uses linear regression for trend detection.
RMA (Relative Moving Average) – Used in RSI-based calculations for smooth momentum readings.
ALMA (Arnaud Legoux Moving Average) – A Gaussian-weighted MA for superior signal clarity.
Hyperbolic MA (HyperMA) – A mathematically optimized averaging method with dynamic weighting.
Each function dynamically adjusts its calculation length to match the available bar count, ensuring instant functionality on all assets.
Fully Optimized for Pine Script v6
This library is built on Pine Script v6, ensuring compatibility with modern TradingView indicators and scripts. It includes exportable functions for seamless integration into custom indicators, making it easy to develop trend-following models, volatility filters, and adaptive risk-management systems.
Why Use Dynamic Moving Averages?
Traditional moving averages suffer from a common limitation: they require a fixed historical window to generate meaningful values. This poses several problems:
New Assets Have No Historical Data - If an asset has only been trading for a short period, traditional moving averages may not be able to generate valid signals.
High Timeframes Require Massive Lookbacks - On 1W or 1M charts, a 200-period SMA would require 200 weeks or months of data, making it unusable on newer assets.
Delayed Signal Initialization - Standard indicators often take dozens of bars to stabilize, reducing effectiveness when trading new trends.
The Dynamic Moving Averages Library eliminates these issues by ensuring that every function:
Starts calculation from bar one, using available data instead of waiting for a lookback period.
Adapts dynamically across timeframes, making it equally effective on low or high timeframes.
Allows smoother, more responsive trend tracking, particularly useful for volatile or low-liquidity assets.
This flexibility makes it indispensable for custom script developers, quantitative analysts, and discretionary traders looking to build more adaptive and resilient indicators.
Final Summary
The Dynamic Moving Averages Library is a versatile and powerful set of functions designed to overcome the limitations of fixed-lookback indicators. By dynamically adjusting the calculation length from the first bar, this library ensures that moving averages remain fully functional across all timeframes and asset types, making it an essential tool for traders and developers alike.
With built-in adaptability, low-lag smoothing, and support for multiple moving average types, this library unlocks new possibilities for quantitative trading and strategy development - especially for assets with short price histories or those traded on higher timeframes.
For traders looking to enhance signal reliability, minimize lag, and build adaptable trading systems, the Dynamic Moving Averages Library provides an efficient and flexible solution.
SMA(sourceData, maxLength)
Dynamic SMA
Parameters:
sourceData (float)
maxLength (int)
EMA(src, length)
Dynamic EMA
Parameters:
src (float)
length (int)
DEMA(src, length)
Dynamic DEMA
Parameters:
src (float)
length (int)
TEMA(src, length)
Dynamic TEMA
Parameters:
src (float)
length (int)
WMA(src, length)
Dynamic WMA
Parameters:
src (float)
length (int)
HMA(src, length)
Dynamic HMA
Parameters:
src (float)
length (int)
VWMA(src, volsrc, length)
Dynamic VWMA
Parameters:
src (float)
volsrc (float)
length (int)
SMMA(src, length)
Dynamic SMMA
Parameters:
src (float)
length (int)
LSMA(src, length, offset)
Dynamic LSMA
Parameters:
src (float)
length (int)
offset (int)
RMA(src, length)
Dynamic RMA
Parameters:
src (float)
length (int)
ALMA(src, length, offset_sigma, sigma)
Dynamic ALMA
Parameters:
src (float)
length (int)
offset_sigma (float)
sigma (float)
HyperMA(src, length)
Dynamic HyperbolicMA
Parameters:
src (float)
length (int)

[GYTS] FiltersToolkit LibraryFiltersToolkit Library
🌸 Part of GoemonYae Trading System (GYTS) 🌸
🌸 --------- 1. INTRODUCTION --------- 🌸
💮 What Does This Library Contain?
This library is a curated collection of high-performance digital signal processing (DSP) filters and auxiliary functions designed specifically for financial time series analysis. It includes a shortlist of our favourite and best performing filters — each rigorously tested and selected for their responsiveness, minimal lag and robustness in diverse market conditions. These tools form an integral part of the GoemonYae Trading System (GYTS), chosen for their unique characteristics in handling market data.
The library contains two main categories:
1. Smoothing filters (low-pass filters and moving averages) for e.g. denoising, trend following
2. Detrending tools (high-pass and band-pass filters, known as "oscillators") for e.g. mean reversion
This collection is finely tuned for practical trading applications and is therefore not meant to be exhaustive. However, will continue to expand as we discover and validate new filtering techniques. I welcome collaboration and suggestions for novel approaches.
🌸 ——— 2. ADDED VALUE ——— 🌸
💮 Unified syntax and comprehensive documentation
The FiltersToolkit Library brings together a wide array of valuable filters under a unified, intuitive syntax. Each function is thoroughly documented, with clear explanations and academic sources that underline the mathematical rigour behind the methods. This level of documentation not only facilitates integration into trading strategies but also helps underlying the underlying concepts and rationale.
💮 Optimised performance and readability
The code prioritizes computational efficiency while maintaining readability. Key optimizations include:
- Minimizing redundant calculations in recursive filters
- Smart coefficient caching
- Efficient state management
- Vectorized operations where applicable
💮 Enhanced functionality and flexibility
Some filters in this library introduce extended functionality beyond the original publications. For instance, the MESA Adaptive Moving Average (MAMA) and Ehlers’ Combined Bandpass Filter incorporate multiple variations found in the literature, thereby providing traders with flexible tools that can be fine-tuned to different market conditions.
🌸 ——— 3. THE FILTERS ——— 🌸
💮 Hilbert Transform Function
This function implements the Hilbert Transform as utilised by John Ehlers. It converts a real-valued time series into its analytic signal, enabling the extraction of instantaneous phase and frequency information—an essential step in adaptive filtering.
Source: John Ehlers - "Rocket Science for Traders" (2001), "TASC 2001 V. 19:9", "Cybernetic Analysis for Stocks and Futures" (2004)
💮 Homodyne Discriminator
By leveraging the Hilbert Transform, this function computes the dominant cycle period through a Homodyne Discriminator. It extracts the in-phase and quadrature components of the signal, facilitating a robust estimation of the underlying cycle characteristics.
Source: John Ehlers - "Rocket Science for Traders" (2001), "TASC 2001 V. 19:9", "Cybernetic Analysis for Stocks and Futures" (2004)
💮 MESA Adaptive Moving Average (MAMA)
An advanced dual-stage adaptive moving average, this function outputs both the MAMA and its companion FAMA. It combines adaptive alpha computation with elements from Kaufman’s Adaptive Moving Average (KAMA) to provide a responsive and reliable trend indicator.
Source: John Ehlers - "Rocket Science for Traders" (2001), "TASC 2001 V. 19:9", "Cybernetic Analysis for Stocks and Futures" (2004)
💮 BiQuad Filters
A family of second-order recursive filters offering exceptional control over frequency response:
- High-pass filter for detrending
- Low-pass filter for smooth trend following
- Band-pass filter for cycle isolation
The quality factor (Q) parameter allows fine-tuning of the resonance characteristics, making these filters highly adaptable to different market conditions.
Source: Robert Bristow-Johnson's Audio EQ Cookbook, implemented by @The_Peaceful_Lizard
💮 Relative Vigor Index (RVI)
This filter evaluates the strength of a trend by comparing the closing price to the trading range. Operating similarly to a band-pass filter, the RVI provides insights into market momentum and potential reversals.
Source: John Ehlers – “Cybernetic Analysis for Stocks and Futures” (2004)
💮 Cyber Cycle
The Cyber Cycle filter emphasises market cycles by smoothing out noise and highlighting the dominant cyclical behaviour. It is particularly useful for detecting trend reversals and cyclical patterns in the price data.
Source: John Ehlers – “Cybernetic Analysis for Stocks and Futures” (2004)
💮 Butterworth High Pass Filter
Inspired by the classical Butterworth design, this filter achieves a maximally flat magnitude response in the passband while effectively removing low-frequency trends. Its design minimises phase distortion, which is vital for accurate signal interpretation.
Source: John Ehlers – “Cybernetic Analysis for Stocks and Futures” (2004)
💮 2-Pole SuperSmoother
Employing a two-pole design, the SuperSmoother filter reduces high-frequency noise with minimal lag. It is engineered to preserve trend integrity while offering a smooth output even in noisy market conditions.
Source: John Ehlers – “Cybernetic Analysis for Stocks and Futures” (2004)
💮 3-Pole SuperSmoother
An extension of the 2-pole design, the 3-pole SuperSmoother further attenuates high-frequency noise. Its additional pole delivers enhanced smoothing at the cost of slightly increased lag.
Source: John Ehlers – “Cybernetic Analysis for Stocks and Futures” (2004)
💮 Adaptive Directional Volatility Moving Average (ADXVma)
This adaptive moving average adjusts its smoothing factor based on directional volatility. By combining true range and directional movement measurements, it remains exceptionally flat during ranging markets and responsive during directional moves.
Source: Various implementations across platforms, unified and optimized
💮 Ehlers Combined Bandpass Filter with Automated Gain Control (AGC)
This sophisticated filter merges a highpass pre-processing stage with a bandpass filter. An integrated Automated Gain Control normalises the output to a consistent range, while offering both regular and truncated recursive formulations to manage lag.
Source: John F. Ehlers – “Truncated Indicators” (2020), “Cycle Analytics for Traders” (2013)
💮 Voss Predictive Filter
A forward-looking filter that predicts future values of a band-limited signal in real time. By utilising multiple time-delayed feedback terms, it provides anticipatory coupling and delivers a short-term predictive signal.
Source: John Ehlers - "A Peek Into The Future" (TASC 2019-08)
💮 Adaptive Autonomous Recursive Moving Average (A2RMA)
This filter dynamically adjusts its smoothing through an adaptive mechanism based on an efficiency ratio and a dynamic threshold. A double application of an adaptive moving average ensures both responsiveness and stability in volatile and ranging markets alike. Very flat response when properly tuned.
Source: @alexgrover (2019)
💮 Ultimate Smoother (2-Pole)
The Ultimate Smoother filter is engineered to achieve near-zero lag in its passband by subtracting a high-pass response from an all-pass response. This creates a filter that maintains signal fidelity at low frequencies while effectively filtering higher frequencies at the expense of slight overshooting.
Source: John Ehlers - TASC 2024-04 "The Ultimate Smoother"
Note: This library is actively maintained and enhanced. Suggestions for additional filters or improvements are welcome through the usual channels. The source code contains a list of tested filters that did not make it into the curated collection.
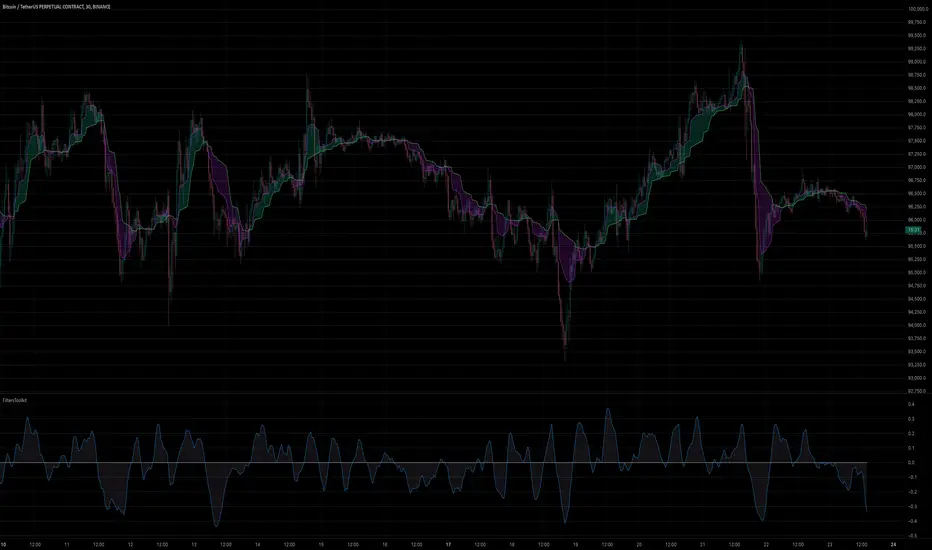
Drawings_publicLibrary "Drawings_public"
: Functions to manage drawings on the chart
extend_line(lineId, labelId)
: Extend specific line with its label
Parameters:
lineId (line)
labelId (label)
update_line_coordinates(lineId, labelId, x1, y1, x2, y2)
: Update specific line coordinates with its label
Parameters:
lineId (line)
labelId (label)
x1 (int)
y1 (float)
x2 (int)
y2 (float)
update_label_coordinates(labelId, value)
: Update coordinates of a label
Parameters:
labelId (label)
value (float)
delete_line(lineId, labelId)
: Delete specific line with its label
Parameters:
lineId (line)
labelId (label)
update_box_coordinates(boxId, labelId, left, top, right, bottom)
: Update specific box coordinates with its label
Parameters:
boxId (box)
labelId (label)
left (int)
top (float)
right (int)
bottom (float)
delete_box(boxId, labelId)
: Delete specific box with its label
Parameters:
boxId (box)
labelId (label)
