ATR BandsIn many strategies, it's quite common to use a scaled ATR to help define a stop-loss, and it's not uncommon to use it for take-profit targets as well. While it's possible to use the built-in ATR indicator and manually calculate the offset value, we felt this wasn't particularly intuitive or efficient, and could lead to the potential for miscalculations. And while there are quite a few indicators that plot ATR bands in some form or another already on TV, we could not find one that actually performed the exact way that we wanted. They all had at least one of the following gaps:
The ATR offset was not configurable (usually hard-coded to be based off the high or low, while we generally prefer to use close)
It would only print a single band (either the upper or lower), which would require the same indicator to be added twice
The ATR scaling factor was either not configurable or only stepped in whole numbers (often time fractional factors like 1.5 yield better results)
To that end, we took to making this enhanced version to meet all of the above requirements. While we were doing so, we decided to take this opportunity to also make some non-functional enhancements as well:
Updated the indicator to the most recent version of Pine
Updated the indicator definition to allow alternate (non-chart) timeframe usage
Made the input types explicitly defined to improve consistency
Updated the inputs with appropriate minimum values and step sizes where appropriate
Separated settings into logical groups
Added helptext to the indicator settings noting usage and common settings values
Explicitly titled the on-chart plots of the ATR bands so that they can more easily be identified and referenced in other indicators/scripts, as well as the Data Window
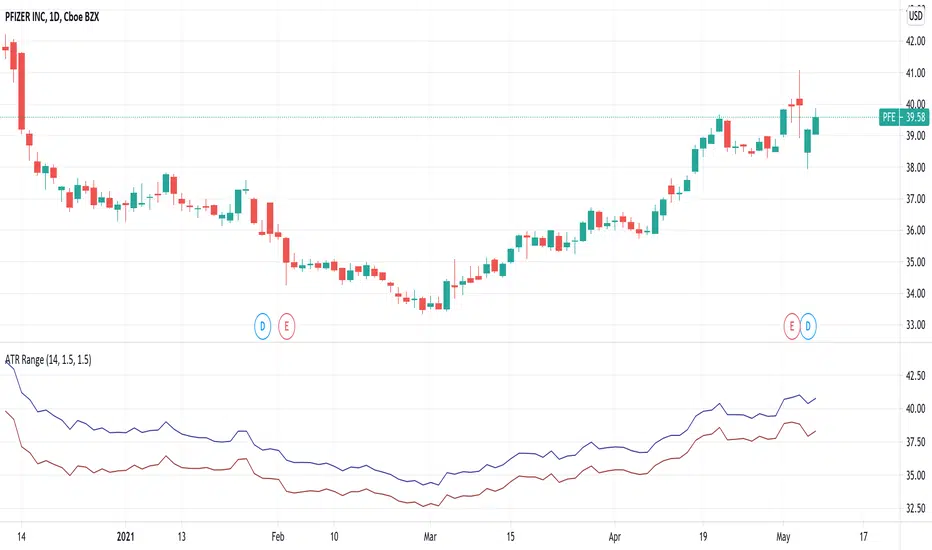
Food for thought : When looking at some of the behaviors of these ATR bands, you can see that when price first levels out, you can draw a "consolidation zone" from the first peak of the upper ATR band to the first valley of the lower ATR band that price will generally respect. Look for price to break and close outside of that zone. When that happens, price will usually (but not always) make a notable move in that direction, which can be used as either a potential trigger or as an additional confluence with other indicators/price action.
Finally, while we have made what we feel are some noteworthy updates and enhancements to this indicator, and have every intention of continuing to do so as we find worthy opportunities for enhancement, credit is still due to the original author: AlexanderTeaH
Indicador Pine Script®