Gann Swing PointsIndicator Logic
This is a GANN-style swing indicator that classifies bars based on their high/low structure relative to the previous bar.
I strongly encourage you to replay bars on Tradingview using this indicator to get a sense of how it creates pivot (or swing) points
Bar Classification:
Up-Bar (direction: 'up'): Higher High and Higher Low (HH/HL)
Down-Bar (direction: 'down'): Lower High and Lower Low (LH/LL)
Outside-Bar (generates 2 directions):
Green: 'down' then 'up'
Red: 'up' then 'down'
Inside-Bar: No direction generated (HL/LH)
Swing Line Logic
The swing line continues in the current direction until n opposite directions are detected.
n is the "n-direction" parameter (commonly set to 2, so 2 consecutive opposite direction is needed to turn the swing)
When n opposing directions occur, the swing turns, creating a pivot point
Inside bar is ignored, so e.g up-bar -> inside-bar -> up-bar generates "up", "up" direction
A top pivot is formed when the swing turns down
A bottom pivot is formed when it turns up
Note: This swing logic is inherently lagging — it only confirms tops/bottoms after the fact
This swing structure gives the system a clear and noise-resistant way to identify pivot points (swing-points)
Swingtrading

True Momentum IndexTrue Momentum Index (TMI) — Precision Trading by Trading_Tomm
The True Momentum Index (TMI) is a cutting-edge technical indicator developed for traders who demand accuracy, clarity, and consistency across all market conditions. Designed by Trading_Tomm , this indicator provides a reliable method to identify high-probability entry and exit points by analyzing real-time momentum shifts and volatility levels.
Key Benefits:
1. Multi-Timeframe Versatility: Whether you're scalping on a 1-minute chart or investing on the weekly, TMI adapts seamlessly to your strategy.
2. Enhanced Risk Management: By highlighting optimal trade zones, TMI helps improve your reward-to-risk ratio and reduce exposure to false signals.
3. Clear Trend Detection: Instantly distinguish between trending, ranging, or consolidating markets.
4. Breakout Confirmation: Spot true breakout opportunities with confidence, supported by Bollinger Band overlays.
5. Universal Applicability: Works effectively with stocks, forex, cryptocurrency, commodities, and indices.
TMI’s intuitive visual presentation and precision signals make it an essential tool for both new and experienced traders. Whether you're trading volatile crypto markets or steady equities, the True Momentum Index gives you the edge to trade with discipline, clarity, and confidence.
Start using the True Momentum Index and take your trading strategy to the next level -maximize potential, minimize uncertainty.

Liquidity ZonesWhat It Does:
Liquidity Zones identifies key areas where institutional traders target stop orders. The indicator automatically detects significant price swings and maps the upper and lower wick zones where liquidity pools form. These zones represent high-probability areas where price is likely to return to collect stop orders before continuing its next move.
How To Use:
Identify Key Zones:
-Red zones highlight Buy Side Liquidity (resistance areas)
-Green zones highlight Sell Side Liquidity (support areas)
Trading Opportunities:
-Enter trades when price respects these zones
-Watch for zone breaks and re-tests for continuation signals
-Use alerts to notify you when price enters a zone or when new zones form
Optimization Tips:
-Adjust lookback periods based on volatility (higher for calmer markets)
-Enable auto-threshold for adaptive sensitivity to market conditions (default setting)
-Most effective on timeframes 4H and above
The indicator tracks when zones are broken and automatically removes them when price returns, providing a clean, uncluttered view of the most relevant liquidity areas on your chart.

UNITED TRADING COMMUNITY WaterMarkWATER MARK indicator. Will allow you to improve the order of the entries you need on the chart.
1. Name and date for the traded instrument
2. Watermarks to protect your charts (in the center and around the perimeter of the chart)
3. The new "notes" option will allow you to keep focus on the factors that are important to you on the chart.
Very flexible settings for any notes, labels, watermarks on the chart that are important to you.
Индикатор WATER MARK . Даст возможность вам улучшить порядок нужных вам записей на графике.
1. Название и дата для торгуемого инструмента
2. Водные знаки для защиты ваших графиков ( в центре и по периметру графика)
3. Новая опция "заметки" позволит вам держать фокус на важных для вас факторах на графике.
Очень гибкая настройка , любых значимых для вас заметок , лейблов , вотермарк на графике.

Apex Edge - MTF Confluence PanelApex Edge – MTF Confluence Panel
Description:
The Apex Edge – MTF Confluence Panel is a powerful multi-timeframe analysis tool built to streamline trade decision-making by aggregating key confluences across three user-defined timeframes. The panel visually presents the state of five core market signals—Trend, Momentum, Sweep, Structure, and Trap—alongside a unified Score column that summarizes directional bias with clarity.
Traders can customize the number of bullish/bearish conditions required to trigger a score signal, allowing the tool to be tailored for both conservative and aggressive trading styles. This script is designed for those who value a clean, structured, and objective approach to identifying market alignment—whether scalping or swing trading.
How it Works:
Across each of the three selected timeframes, the panel evaluates:
Trend: Based on a user-configurable Hull Moving Average (HMA), the script compares price relative to trend to determine bullish, bearish, or neutral bias.
Momentum: Uses OBV (On-Balance Volume) with volume spike detection to identify bursts of strong buying or selling pressure.
Sweep: Detects potential liquidity grabs by identifying price rejections beyond prior swing highs/lows. A break below a previous low with reversal signals bullish intent (and vice versa for bearish).
Structure: Uses dynamic pivot-based logic to identify market structure breaks (BOS) beyond recent confirmed swing levels.
Trap: Flags potential false moves by measuring RSI overbought/oversold signal clusters combined with minimal price movement—highlighting exhaustion or deceptive breaks.
Score: A weighted consensus of the above components. The number of required confluences to trigger a score (default: 3) can be set by the user via input, offering flexibility in signal sensitivity.
Why It’s Useful for Traders:
Quick Decision-Making: The color-coded panel provides instant visual feedback on whether confluences align across timeframes—ideal for fast-paced environments like scalping or high-volatility news sessions.
Multi-Timeframe Confidence: Helps eliminate guesswork by confirming whether higher and lower timeframe conditions support your trade idea.
Customizability: Adjustable confluence threshold means traders can fine-tune how sensitive the system is—more signals for faster entries, stricter confluence for higher conviction trades.
Built-In Alerts: Automated alerts for score alignment, trap detection, and liquidity sweeps allow traders to stay informed even when away from the screen.
Strategic Edge: Supports directional bias confirmation and trade filtering with logic designed to mimic professional decision-making workflows.
Features:
Clean, real-time confluence table across three user-selected timeframes
Configurable score sensitivity via “Minimum Confluences for Score” input
Cell-based colour coding for at-a-glance trade direction
Built-in alerts for score alignment, traps, and sweep triggers
Note - This Indicator works great in sync with Apex Edge - Session Sweep Pro
Useful levels for TP = previous session high/low boxes or fib levels.
⚠️ Disclaimer:
This script is for informational and educational purposes only and should not be considered financial advice. Always perform your own due diligence and practice proper risk management when trading.

Suvorov Pro SFP+Indicator: Logic-based Swing Failure Pattern (SFP)
What is the logic of my indicator based on and what makes it unique:
1. The indicator can calculate extreme candles that close with huge shadows and a small body and it works on any timeframe.
2. The indicator analyzes the volumes on which the desired bar was closed. This function is customizable. That is, you can build a search for signals according to your trading strategy, based on the number of volumes. What does this mean - you select the number of previous bars where the indicator calculates the average value and based on these numbers, you can set up: how many times the desired candle should be larger than the previous average volume.
3. Since SFP is based on the removal of important liquidity, the search for such situations occurs from swing structures (swing high/low). When these parameters are found on the chart (on history), the indicator draws the situation and shows where important liquidity was removed and why the trading situation appeared right now.
4. The indicator gives recommendations on possible takes and stops.
The structure of takes has a built-in logic for searching for previous swings to remove liquidity, as well as searching for imbalances to cover them (50 and 100%).
5. For TP (Take Profit): there are 3 TPthat can be adjusted to your trading strategy (Risk/Profit). For example: you always trade from 2 to 1 on the 1st Take, 3 to 1 on the second, 5 to 1 on the third: you can set all this in the indicator and all your targets will be detected by the indicator, taking into account the logic of searching for important ranges. If, for example, in your 3 to 1 range there are no important zones for TP, then the indicator writes that NaN (not found).
6. The indicator works on any timeframe.
7. The indicator has a built-in RSI logic, which comes as an additional function to the indicator. If this function is enabled, then trading situations are detected only when there is a divergence (from the swing point to the extreme bar that has formed).

Parsifal.Swing.TrendScoreThe Parsifal.Swing.TrendScore indicator is a module within the Parsifal Swing Suite, which includes a set of swing indicators such as:
• Parsifal Swing TrendScore
• Parsifal Swing Composite
• Parsifal Swing RSI
• Parsifal Swing Flow
Each module serves as an indicator facilitating judgment of the current swing state in the underlying market.
________________________________________
Background
Market movements typically follow a time-varying trend channel within which prices oscillate. These oscillations—or swings—within the trend are inherently tradable.
They can be approached:
• One-sidedly, aligning with the trend (generally safer), or
• Two-sidedly, aiming to profit from mean reversions as well.
Note: Mean reversions in strong trends often manifest as sideways consolidations, making one-sided trades more stable.
________________________________________
The Parsifal Swing Suite
The modules aim to provide additional insights into the swing state within a trend and offer various trigger points to assist with entry decisions.
All modules in the suite act as weak oscillators, meaning they fluctuate within a range but are not bounded like true oscillators (e.g., RSI, which is constrained between 0% and 100%).
________________________________________
The Parsifal.Swing.TrendScore – Specifics
The Parsifal.Swing.TrendScore module combines short-term trend data with information about the current swing state, derived from raw price data and classical technical indicators. It provides an indication of how well the short-term trend aligns with the prevailing swing, based on recent market behavior.
________________________________________
How Swing.TrendScore Works
The Swing.TrendScore calculates a swing score by collecting data within a bin (i.e., a single candle or time bucket) that signals an upside or downside swing. These signals are then aggregated together with insights from classical swing indicators.
Additionally, it calculates a short-term trend score using core technical signals, including:
• The Z-score of the price's distance from various EMAs
• The slope of EMAs
• Other trend-strength signals from additional technical indicators
These two components—the swing score and the trend score—are then combined to form the Swing.TrendScore indicator, which evaluates the short-term trend in context with swing behavior.
________________________________________
How to Interpret Swing.TrendScore
The trend component enhances Swing.TrendScore’s ability to provide stronger signals when the short-term trend and swing state align.
It can also override the swing score; for example, even if a mean reversion appears to be forming, a dominant short-term trend may still control the market behavior.
This makes Swing.TrendScore particularly valuable for:
• Short-term trend-following strategies
• Medium-term swing trading
Unlike typical swing indicators, Swing.TrendScore is designed to respond more to medium-term swings rather than short-lived fluctuations.
________________________________________
Behavior and Chart Representation
The Swing.TrendScore indicator fluctuates within a range, as most of its components are range-bound (though Z-score components may technically extend beyond).
• Historically high or low values may suggest overbought or oversold conditions
• The chart displays:
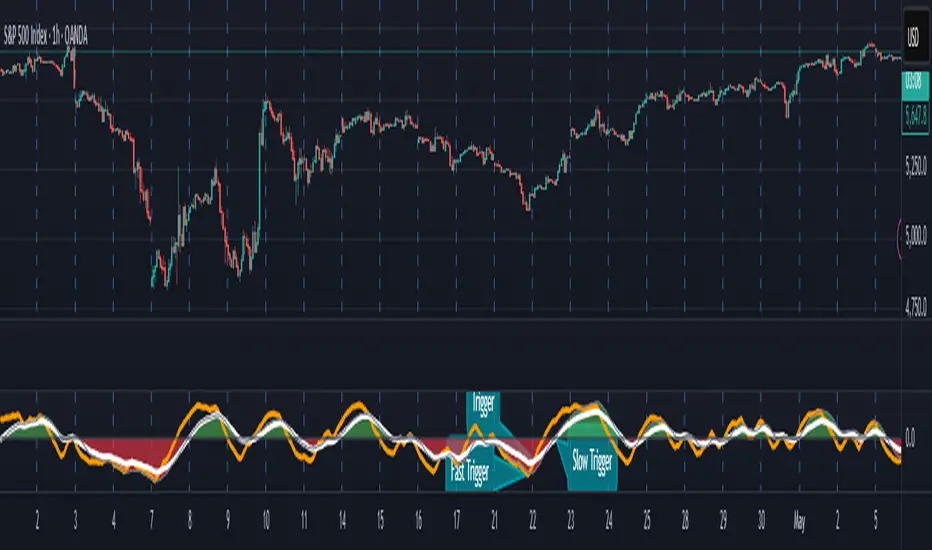
o A fast curve (orange)
o A slow curve (white)
o A shaded background representing the market state
• Extreme values followed by curve reversals may signal a developing mean reversion
________________________________________
TrendScore Background Value
The Background Value reflects the combined state of the short-term trend and swing:
• > 0 (shaded green) → Bullish mode: swing and short-term trend both upward
• < 0 (shaded red) → Bearish mode: swing and short-term trend both downward
• The absolute value represents the confidence level in the market mode
Notably, the Background Value can remain positive during short downswings if the short-term trend remains bullish—and vice versa.
________________________________________
How to Use the Parsifal.Swing.TrendScore
Several change points can act as entry triggers or aids:
• Fast Trigger: change in slope of the fast signal curve
• Trigger: fast line crosses slow line or the slope of the slow signal changes
• Slow Trigger: change in sign of the Background Value
Examples of these trigger points are illustrated in the accompanying chart.
Additionally, market highs and lows aligning with the swing indicator values may serve as pivot points in the evolving price process.
________________________________________
As always, this indicator should be used in conjunction with other tools and market context in live trading.
While it provides valuable insight and potential entry points, it does not predict future price action.
Instead, it reflects recent tendencies and should be used judiciously.
________________________________________
Extensions
The aggregation of information—whether derived from bins or technical indicators—is currently performed via simple averaging. However, this can be modified using alternative weighting schemes, based on:
• Historical performance
• Relevance of the data
• Specific market conditions
Smoothing periods used in calculations are also modifiable. In general, the EMAs applied for smoothing can be extended to reflect expectations based on relevance-weighted probability measures.
Since EMAs inherently give more weight to recent data, this allows for adaptive smoothing.
Additionally, EMAs may be further extended to incorporate negative weights, akin to wavelet transform techniques.

Parsifal.Swing.CompositeThe Parsifal.Swing.Composite indicator is a module within the Parsifal Swing Suite, which includes a set of swing indicators such as:
• Parsifal Swing TrendScore
• Parsifal Swing Composite
• Parsifal Swing RSI
• Parsifal Swing Flow
Each module serves as an indicator facilitating judgment of the current swing state in the underlying market.
________________________________________
Background
Market movements typically follow a time-varying trend channel within which prices oscillate. These oscillations—or swings—within the trend are inherently tradable.
They can be approached:
• One-sidedly, aligning with the trend (generally safer), or
• Two-sidedly, aiming to profit from mean reversions as well.
Note: Mean reversions in strong trends often manifest as sideways consolidations, making one-sided trades more stable.
________________________________________
The Parsifal Swing Suite
The modules aim to provide additional insights into the swing state within a trend and offer various trigger points to assist with entry decisions.
All modules in the suite act as weak oscillators, meaning they fluctuate within a range but are not bounded like true oscillators (e.g., RSI, which is constrained between 0% and 100%).
________________________________________
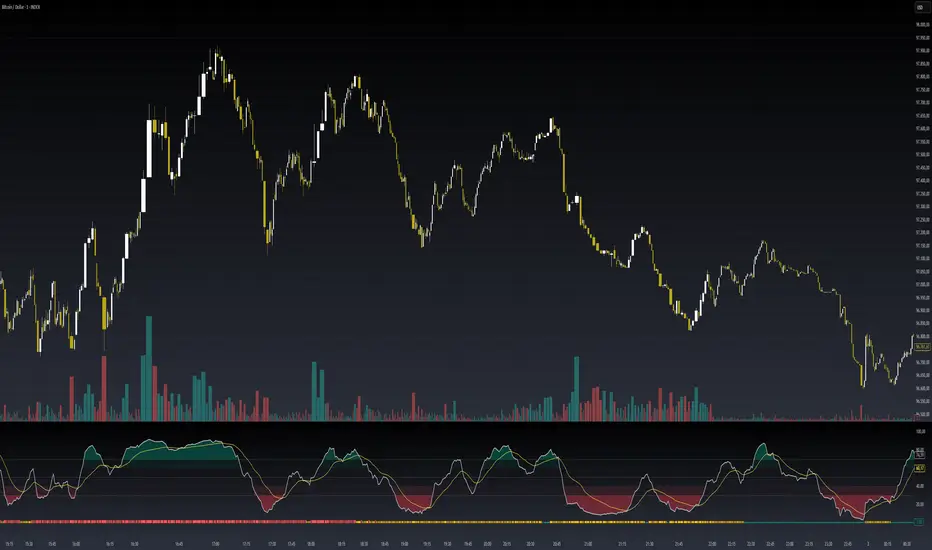
The Parsifal.Swing.Composite – Specifics
This module consolidates multiple insights into price swing behavior, synthesizing them into an indicator reflecting the current swing state.
It employs layered bagging and smoothing operations based on standard price inputs (OHLC) and classical technical indicators. The module integrates several slightly different sub-modules.
Process overview:
1. Per candle/bin, sub-modules collect directional signals (up/down), with each signal casting a vote.
2. These votes are aggregated via majority counting (bagging) into a single bin vote.
3. Bin votes are then smoothed, typically with short-term EMAs, to create a sub-module vote.
4. These sub-module votes are aggregated and smoothed again to generate the final module vote.
The final vote is a score indicating the module’s assessment of the current swing state. While it fluctuates in a range, it's not a true oscillator, as most inputs are normalized via Z-scores (value divided by standard deviation over a period).
• Historically high or low values correspond to high or low quantiles, suggesting potential overbought or oversold conditions.
• The chart displays a fast (orange) and slow (white) curve against a solid background state.
• Extreme values followed by curve reversals may signal upcoming mean-reversions.
Background Value:
• Value > 0: shaded green → bullish mode
• Value < 0: shaded red → bearish mode
• The absolute value indicates confidence in the mode.
________________________________________
How to Use the Parsifal.Swing.Composite
Several change points in the indicator serve as potential entry triggers:
• Fast Trigger: change in slope of the fast curve
• Trigger: fast line crossing the slow line or change in the slow curve’s slope
• Slow Trigger: change in sign of the background value
These are illustrated in the introductory chart.
Additionally, market highs and lows aligned with swing values may act as pivot points, support, or resistance levels for evolving price processes.
________________________________________
As always, supplement this indicator with other tools and market information. While it provides valuable insights and potential entry points, it does not predict future prices. It reflects recent tendencies and should be used judiciously.
________________________________________
Extensions
All modules in the Parsifal Swing Suite are simple yet adaptable, whether used individually or in combination.
Customization options:
• Weights in EMAs for smoothing are adjustable
• Bin vote aggregation (currently via sum-of-experts) can be modified
• Alternative weighting schemes can be tested
Advanced options:
• Bagging weights may be historical, informational, or relevance-based
• Selection algorithms (e.g., ID3, C4.5, CAT) could replace the current bagging approach
• EMAs may be generalized into expectations relative to relevance-based probability
• Negative weights (akin to wavelet transforms) can be incorporated
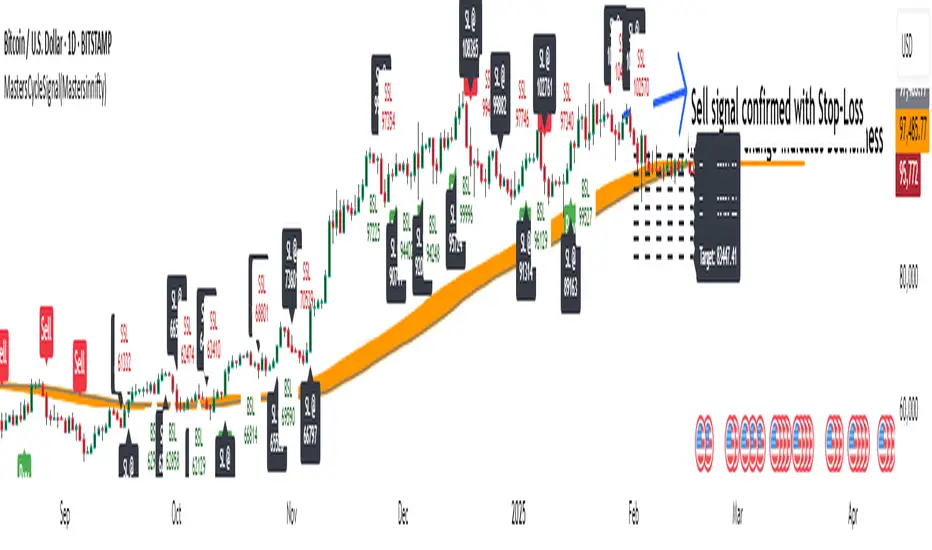
MastersCycleSignal(Mastersinnifty)Overview
MastersCycleSignal is a high-precision market timing and projection indicator for trend-following and swing traders.
It combines an adaptive cycle detection algorithm, forward-looking sine wave projections, dynamic momentum confirmation, and Gann Square of 9-based geometric targets into a complete structured trading framework.
The script continuously analyzes price oscillations to detect dominant cycles, projects expected price behavior with future-facing sine approximations, and generates buy/sell signals once confirmed by adaptive momentum filtering.
Upon confirmation, it calculates mathematically consistent Gann-based target levels and risk-managed stop-loss suggestions.
Users also benefit from auto-extending targets as price action unfolds — helping traders anticipate rather than react to market shifts.
---
Uniqueness
MastersCycleSignal stands apart through a unique fusion of techniques:
- Dynamic Cycle Detection
- Detects dominant cycles using a cosine correlation maximization method between detrended price (close minus SMA) and theoretical cosine curves, dynamically recalibrated across a sliding window.
- Sine Wave Future Projection
- Smooths and projects future price paths by approximating a forward sine wave based on the real-time detected dominant cycle.
- Adaptive Momentum Filtering
- Volatility is scaled by divergence between normalized returns and a 5-period EMA, further adjusted by an RSI(2) factor.
- This makes buy/sell signal confirmation robust against noise and false breakouts.
- Gann-Based Target Computation
- Uses a square-root transformation of price, incremented by selectable Gann Square of 9 degrees, for calculating progressive and dynamically expanding price targets.
- Auto-Extending Targets
- As price achieves a projected target, the system automatically draws subsequent new targets based on the prior target differential — providing continuous guidance in trending conditions.
---
Usefulness
MastersCycleSignal is built to help traders:
- Identify early trend reversals through cycle shifts.
- Forecast probable price paths in advance.
- Plan systematic target and stop-loss zones with geometric accuracy.
- Reduce guesswork in trend-following and swing trading.
- Maintain structured discipline across intraday, swing, and positional strategies.
It works seamlessly across stocks, indices, forex, commodities, and crypto markets — on any timeframe.
---
How to Use
- Attach the indicator to your desired chart.
- When a Buy Signal or Sell Signal appears (green or red markers):
- Use the attached stop-loss labels to manage risk.
- Monitor the automatically plotted target lines for partial exits or full profits.
- The orange projected sine wave illustrates the expected future market path.
- Customization Options:
- Cycle Detection Length — adjust to fine-tune cycle sensitivity.
- Projection Length — modify the forward distance of sine wave forecast.
- Gann Square of 9 Degrees — personalize target increments.
- Toggle Signals and Target visibility as needed.
---
Disclaimer
- MastersCycleSignal uses no future data or lookahead bias.
- All projections are based on geometric extrapolations from historical price action — not guaranteed predictions.
- Trading involves risks, and historical cycle behavior may differ in future conditions.
Swing High/Low Scalper(Mastersinnifty)Overview
The Swing High/Low Scalper is designed for traders seeking structured entries and disciplined stop-loss planning during momentum shifts. It combines smoothed Force Index readings with swing high/low analysis to identify moments where both momentum and structural price levels align.
When a new directional bias is confirmed, the indicator plots clear entry signals and dynamically calculates the nearest logical stop-loss level based on recent swing points.
---
Core Logic
- Force Index Bias Detection
- The Force Index (price × volume change) is smoothed with an EMA to determine sustained bullish or bearish momentum.
- Signal Memory and Noise Reduction
- The indicator remembers the last signal (buy/sell) and only triggers a new signal when the bias changes, helping avoid redundant entries in sideways or noisy conditions.
- Swing-based Stop-Loss Calculation
- Upon signal confirmation, the script automatically plots a stop-loss label near the most recent swing low (for buys) or swing high (for sells).
- If conditions are extreme, fallback safety checks are used to validate the stop-loss placement.
---
Key Features
- Dynamic, structure-based stop-loss plots at every trade signal.
- Visual background bias:
- Green tint = Bullish bias
- Red tint = Bearish bias
- Minimalist and clean chart visualization for easy interpretation.
- Designed for scalability across timeframes (from 1-minutes to daily charts).
---
Why It’s Unique
- Unlike simple momentum oscillators or swing indicators, this tool integrates a state-tracking mechanism.
- A signal is only generated when a true shift in directional force occurs and swing structure supports the move, seeking to catch only meaningful changes rather than every minor fluctuation.
- This dual-filter approach emphasizes quality over quantity, aiming for disciplined entries with risk levels derived from actual price behavior, not arbitrary formulas.
---
How to Use
- Apply the Script to your desired chart and timeframe.
- Look for Signals:
- Green Up Arrow = Buy Signal
- Red Down Arrow = Sell Signal
- Observe Stop-Loss Labels
- Use the plotted SL labels for setting exit points based on recent swing structure.
- Monitor Background Bias:
- Green or Red background hints at prevailing directional momentum.
---
Important Disclaimer
This tool is intended to assist technical analysis and trade planning.
It does not provide financial advice or guarantee any future performance.
Always use additional risk management practices when trading.

SynchroTrend Oscillator (STO) [PhenLabs]📊 SynchroTrend Oscillator
Version: PineScript™ v5
📌 Description
The SynchroTrend Oscillator (STO) is a multi-timeframe synchronization tool that combines trend information from three distinct timeframes into a single, easy-to-interpret oscillator ranging from -100 to +100.
This indicator solves the common problem of having to analyze multiple timeframe charts separately by consolidating trend direction and strength across different time horizons. The STO helps traders identify when markets are truly synchronized across timeframes, potentially indicating stronger trend conditions and higher probability trading opportunities.
Using either Moving Average crossovers or RSI analysis as the trend definition metric, the STO provides a comprehensive view of market structure that adapts to various trading strategies and market conditions.
🚀 Points of Innovation
Triple-timeframe synchronization in a single view eliminates chart switching
Dual trend detection methods (MA vs Price or RSI) for flexibility across different markets
Dynamic color intensity that automatically increases with signal strength
Scaled oscillator format (-100 to +100) for intuitive trend strength interpretation
Customizable signal thresholds to match your risk tolerance and trading style
Visual alerts when markets reach full synchronization states
🔧 Core Components
Trend Scoring System: Calculates a binary score (+1, -1, or 0) for each timeframe based on selected metrics, providing clear trend direction
Multi-Timeframe Synchronization: Combines and scales trend scores from all three timeframes into a single oscillator
Dynamic Visualization: Adjusts color transparency based on signal strength, creating an intuitive visual guide
Threshold System: Provides customizable levels for identifying potentially significant trading opportunities
🔥 Key Features
Triple Timeframe Analysis: Synchronizes three user-defined timeframes (default: 60min, 15min, 5min) into one view
Dual Trend Detection Methods: Choose between Moving Average vs Price or RSI-based trend determination
Adjustable Signal Smoothing: Apply EMA, SMA, or no smoothing to the oscillator output for your preferred signal responsiveness
Dynamic Color Intensity: Colors become more vibrant as signal strength increases, helping identify strongest setups
Customizable Thresholds: Set your own buy/sell threshold levels to match your trading strategy
Comprehensive Alerts: Six different alert conditions for crossing thresholds, zero line, and full synchronization states
🎨 Visualization
Oscillator Line: The main line showing the synchronized trend value from -100 to +100
Dynamic Fill: Area between oscillator and zero line changes transparency based on signal strength
Threshold Lines: Optional dotted lines indicating buy/sell thresholds for visual reference
Color Coding: Green for bullish synchronization, red for bearish synchronization
📖 Usage Guidelines
Timeframe Settings
Timeframe 1: Default: 60 (1 hour) - Primary higher timeframe for trend definition
Timeframe 2: Default: 15 (15 minutes) - Intermediate timeframe for trend definition
Timeframe 3: Default: 5 (5 minutes) - Lower timeframe for trend definition
Trend Calculation Settings
Trend Definition Metric: Default: “MA vs Price” - Method used to determine trend on each timeframe
MA Type: Default: EMA - Moving Average type when using MA vs Price method
MA Length: Default: 21 - Moving Average period when using MA vs Price method
RSI Length: Default: 14 - RSI period when using RSI method
RSI Source: Default: close - Price data source for RSI calculation
Oscillator Settings
Smoothing Type: Default: SMA - Applies smoothing to the final oscillator
Smoothing Length: Default: 5 - Period for the smoothing function
Visual & Threshold Settings
Up/Down Colors: Customize colors for bullish and bearish signals
Transparency Range: Control how transparency changes with signal strength
Line Width: Adjust oscillator line thickness
Buy/Sell Thresholds: Set levels for potential entry/exit signals
✅ Best Use Cases
Trend confirmation across multiple timeframes
Finding high-probability entry points when all timeframes align
Early detection of potential trend reversals
Filtering trade signals from other indicators
Market structure analysis
Identifying potential divergences between timeframes
⚠️ Limitations
Like all indicators, can produce false signals during choppy or ranging markets
Works best in trending market conditions
Should not be used in isolation for trading decisions
Past performance is not indicative of future results
May require different settings for different markets or instruments
💡 What Makes This Unique
Combines three timeframes in a single visualization without requiring multiple chart windows
Dynamic transparency feature that automatically emphasizes stronger signals
Flexible trend definition methods suitable for different market conditions
Visual system that makes multi-timeframe analysis intuitive and accessible
🔬 How It Works
1. Trend Evaluation:
For each timeframe, the indicator calculates a trend score (+1, -1, or 0) using either:
MA vs Price: Comparing close price to a moving average
RSI: Determining if RSI is above or below 50
2. Score Aggregation:
The three trend scores are combined and then scaled to a range of -100 to +100
A value of +100 indicates all timeframes show bullish conditions
A value of -100 indicates all timeframes show bearish conditions
Values in between indicate varying degrees of alignment
3. Signal Processing:
The raw oscillator value can be smoothed using EMA, SMA, or left unsmoothed
The final value determines line color, fill color, and transparency settings
Threshold levels are applied to identify potential trading opportunities
💡 Note:
The SynchroTrend Oscillator is most effective when used as part of a comprehensive trading strategy that includes proper risk management techniques. For best results, consider using the oscillator in conjunction with support/resistance levels, price action analysis, and other complementary indicators that align with your trading style.

RSI-MACD Momentum Fusion Indicator(RMFI)📈 RSI-MACD Momentum Fusion Indicator (RMFI)
The RMFI combines the strengths of two RSI variants with a dynamically adaptive MACD module into a powerful momentum oscillator ranging from 0 to 100. The goal is to unify converging momentum information from different perspectives into a clear, weighted overall signal.
🔧 Core Features
RSI 1: Classic Wilder RSI, sensitive to short-term momentum.
RSI 2: Modified RSI based on normalized price movement ranges (Range Momentum).
MACD (3 Modes):
Standardized (min/max-based)
Fully adaptive (Z-score normalization)
50% adaptive (hybrid weighting of both approaches)
Dynamic MACD mode selection (optional): Automatic switching of MACD normalization based on volatility levels (ATR-based).
Signal Line: Smoothed average of all components to visualize momentum trends and crossovers.
🎯 Visualization
Clear separation of overbought (>70) and oversold (<30) zones with color highlighting.
Different colors based on the dynamic MACD mode – visually indicates how strongly the market adapts to volatility.
⚙️ Recommended Use
Ideal for trend following, divergence confirmation (with external divergence logic), and momentum reversals.
Particularly effective in volatile markets, as the MACD component adaptively responds to instability.
© champtrades
ScalpSwing Pro SetupScript Overview
This script is a multi-tool setup designed for both scalping (1m–5m) and swing trading (1H–4H–Daily). It combines the power of trend-following , momentum , and mean-reversion tools:
What’s Included in the Script
1. EMA Indicators (20, 50, 200)
- EMA 20 (blue) : Short-term trend
- EMA 50 (orange) : Medium-term trend
- EMA 200 (red) : Long-term trend
- Use:
- EMA 20 crossing above 50 → bullish trend
- EMA 20 crossing below 50 → bearish trend
- Price above 200 EMA = uptrend bias
2. VWAP (Volume Weighted Average Price)
- Shows the average price weighted by volume
- Best used in intraday (1m to 15m timeframes)
- Use:
- Price bouncing from VWAP = reversion trade
- Price far from VWAP = likely pullback incoming
3. RSI (14) + Key Levels
- Shows momentum and overbought/oversold zones
- Levels:
- 70 = Overbought (potential sell)
- 30 = Oversold (potential buy)
- 50 = Trend confirmation
- Use:
- RSI 30–50 in uptrend = dip buying zone
- RSI 70–50 in downtrend = pullback selling zone
4. MACD Crossovers
- Standard MACD with histogram & cross alerts
- Shows trend momentum shifts
- Green triangle = Bullish MACD crossover
- Red triangle = Bearish MACD crossover
- Use:
- Confirm swing trades with MACD crossover
- Combine with RSI divergence
5. Buy & Sell Signal Logic
BUY SIGNAL triggers when:
- EMA 20 crosses above EMA 50
- RSI is between 50 and 70 (momentum bullish, not overbought)
SELL SIGNAL triggers when:
- EMA 20 crosses below EMA 50
- RSI is between 30 and 50 (bearish momentum, not oversold)
These signals appear as:
- BUY : Green label below the candle
- SELL : Red label above the candle
How to Trade with It
For Scalping (1m–5m) :
- Focus on EMA crosses near VWAP
- Confirm with RSI between 50–70 (buy) or 50–30 (sell)
- Use MACD triangle as added confluence
For Swing (1H–4H–Daily) :
- Look for EMA 20–50 cross + price above EMA 200
- Confirm trend with MACD and RSI
- Trade breakout or pullback depending on structure

Candlestick Pattern Indicator – Doji, Harami, More [algo_aakash]This Candlestick Pattern Indicator is designed to help traders identify key price action patterns like Bullish Engulfing, Bearish Engulfing, Doji, Hammer, Morning Star, Evening Star, and many more directly on your TradingView chart. With customizable options to display both bullish and bearish patterns , this indicator provides real-time visual markers and labels, helping you make informed trading decisions.
Key features of the indicator include:
Detects popular candlestick patterns such as Bullish Engulfing, Bearish Engulfing, Hammer, Morning Star, Tweezer Tops, and more.
Customizable settings for displaying pattern shapes, labels, and opacity, tailored to your trading preferences.
Option to plot signals only after a candle closes, ensuring accuracy.
Alerts for immediate notification of detected patterns.
Visual markers on the chart, including arrows and labels, for quick recognition of potential trade setups.
This indicator is ideal for traders who rely on candlestick patterns for technical analysis and want an automated tool to highlight these setups for easier decision-making.
Whether you're a beginner or an experienced trader, this tool will help you spot important patterns in real-time without cluttering your chart.

Swing Structure + Session Sweeps“Scalper-Friendly Trend & Sweep Detector”
Swing Structure + Session Sweeps with TEMA Cloud
This powerful all-in-one tool is designed for intraday traders, swing traders, and scalpers who want to spot high-probability reversals, trend continuations, and liquidity sweeps with confluence.
🔹 Core Features
Multi-layered TEMA Cloud (9, 20, 34, 50) for clear trend structure
Dynamic Bull/Bear labels when the trend flips
Centerline for TEMA 20 to visualize core trend direction
Session-based liquidity sweep detection (Asia, London, NY)
Volume and absorption dots to catch hidden pressure
Swing high/low detection (external and internal)
Visual VWAP, daily highs/lows, and customizable session zones
Optional alerts for volume spikes, absorption, and reversal sweeps
📈 Use it to:
Confirm directional bias
Anticipate pullbacks and breakouts
Identify volume-backed reversals
Align trades with session strength and swing confluence
⚙️ Built for scalpers, intraday opportunists, and precision chartists alike.

FunkyQuokka's $ Volume💡 Why $ Volume Matters
Share volume alone is a half-truth — 1M shares traded at $5 isn’t the same as 1M shares at $500. That’s where dollar volume steps in, offering a far more accurate view of institutional interest, breakout validity, liquidity zones and overall trader conviction.
📈 Features:
Clean histogram of dollar volume (close × volume)
Orange line showing customizable average $ volume
K/M/B formatting for axis scale (no huge ugly numbers)
Minimal design to blend into a multi-pane layout
⚙️ Inputs:
Tweakable average length – defaults to 20
By FunkyQuokka 🦘

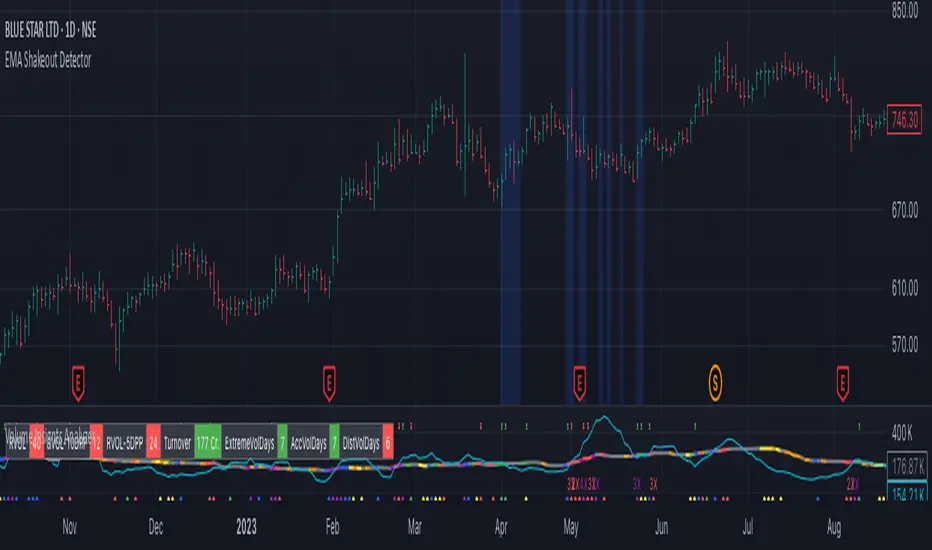
EMA Shakeout DetectorEMA Shakeout & Reclaim Zones
Description:
This Pine Script helps traders quickly identify potential shakeout entries based on price action and volume dynamics. Shakeouts often signal strong accumulation, where institutions drive the stock below a key moving average before reclaiming it, creating an opportunity for traders to enter at favorable prices.
How It Works:
1. Volume Surge Filtering:
a. Computes the 51-day Simple Moving Average (SMA) of volume.
b. Identifies days where volume surged 2x above the 51-day average.
c. Filters stocks that had at least two such high-volume days in the last 21 trading days (configurable).
2. Stock Selection Criteria:
a. The stock must be within 25% of its 52-week high.
b. It should have rallied at least 30% from its 52-week low.
Shakeout Conditions:
1. The stock must be trading above the 51-day EMA before the shakeout.
2. A sudden price drop of more than 10% occurs, pushing the stock below the 51-day EMA.
3. A key index (e.g., Nifty 50, S&P 500) must be trading above its 10-day EMA, ensuring overall market strength.
Visualization:
Shakeout zones are highlighted in blue, making it easier to spot potential accumulation areas and study price & volume action in more detail.
This script is ideal for traders looking to identify institutional shakeouts and gain an edge by recognizing high-probability reversal setups.
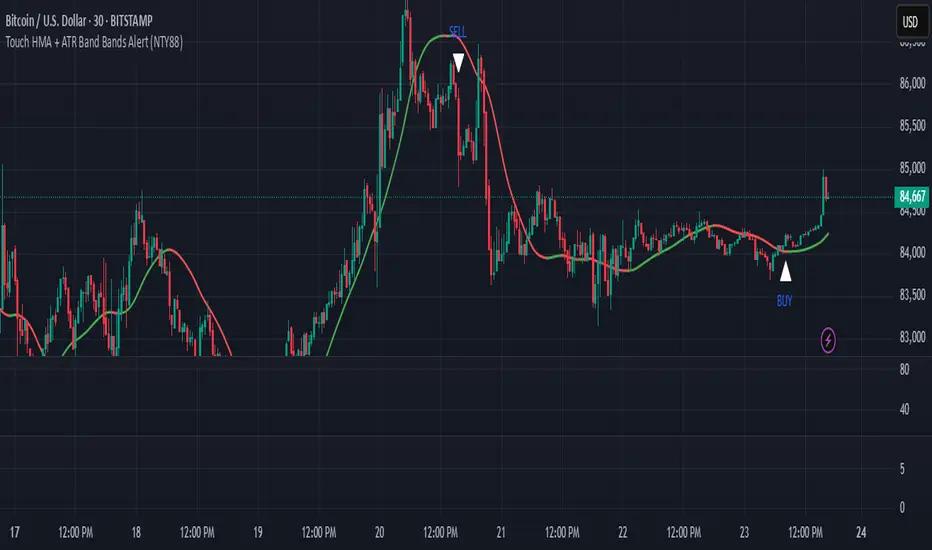
Touch HMA + ATR Band Bands Alert (NTY88)🔔 Precision Alerts | No Repainting | ATR-Based Touch Detection | HMA Trend Coloring
This script is a clean and powerful tool designed to help you catch precise market reversals using ATR Band touches combined with trend-following logic.
📌 How It Works
A custom Hull Moving Average (HMA) is used to track the trend.
Two dynamic ATR-based bands are drawn above and below the HMA.
A signal is generated when the closing price touches the upper or lower ATR band within a small tolerance zone.
✅ Key Features
🔁 Alternating Signals: Only one Buy → then one Sell → then Buy again. No signal spam.
🟢🔴 Color-Changing HMA Line: Green = HMA rising | Red = HMA falling
📏 Price Tolerance Input: Define how close the candle must be to the ATR band to trigger a signal.
🔔 Real-Time Alerts: Easily set alerts for Buy and Sell signals — works in live markets.
🚫 No Repainting: All signals are confirmed at candle close and will not change afterward.
🎯 When to Use
Great for trend reversals, scalping zones, or identifying potential exhaustion points.
Works well on any timeframe or market (crypto, stocks, forex).
💬 Pro Tip:
Combine this with RSI, Volume, or ADX filters to build a complete confluence system.
📈 Built for traders who love clean logic, precision entries, and visual clarity.
Highest High Line with Multi-Timeframe Supertrend and RSIOverview:
This powerful indicator combines three essential elements for traders:
Highest High Line – Tracks the highest price over a customizable lookback period across different timeframes.
Multi-Timeframe Supertrend – Displays Supertrend values and trend directions for multiple timeframes simultaneously.
Relative Strength Index (RSI) – Shows RSI values across different timeframes for momentum analysis.
Features:
✅ Customizable Highest High Line:
Selectable timeframes: Daily, Weekly, Monthly, Quarterly, Yearly
Adjustable lookback period
✅ Multi-Timeframe Supertrend:
Supports 1min, 5min, 10min, 15min, 30min, 1H, Daily, Weekly, Monthly, Quarterly, Yearly
ATR-based calculation with configurable ATR period and multiplier
Identifies bullish (green) & bearish (red) trends
✅ Multi-Timeframe RSI:
Calculates RSI for the same timeframes as Supertrend
Overbought (≥70) and Oversold (≤30) signals with color coding
✅ Comprehensive Table Display:
A clean, structured table in the bottom-right corner
Displays Supertrend direction, value, and RSI for all timeframes
Helps traders quickly assess trend and momentum alignment
How to Use:
Use the Highest High Line to identify key resistance zones.
Confirm trend direction with Multi-Timeframe Supertrend.
Check RSI values to avoid overbought/oversold conditions before entering trades.
Align multiple timeframes for stronger confirmation of trend shifts.
Ideal For:
✅ Scalpers (lower timeframes: 1m–30m)
✅ Swing Traders (higher timeframes: 1H–D)
✅ Position Traders (Weekly, Monthly, Quarterly)
💡 Tip: Look for Supertrend & RSI confluence across multiple timeframes for higher probability setups.

ADR Checker - Breakouts📈 ADR Checker – Breakouts
Gain the edge by knowing when a stock has already made its move.
🚀 What It Does:
The ADR Checker - Breakouts is a powerful yet simple visual tool that helps traders instantly assess whether a stock has already exceeded its Average Daily Range (ADR) for the day — a critical piece of information for momentum traders, swing traders, and especially those following breakout, VCP, or CANSLIM strategies.
Using a customizable on-screen table that always stays in view (regardless of zoom or chart scaling), this script shows:
✅ Average ADR% – 20-day average range, calculated in %.
📊 Today’s Move – how much the stock has moved today.
🔥 % of Avg ADR – today's move relative to its historical average, with live color feedback:
🟥 Over 100% (Overextended – danger!)
🟧 70-100% (Caution zone)
🟩 Below 70% (Room to move)
💡 Why It Matters:
One of the most overlooked mistakes by breakout traders is entering a trade after the move has already happened. If a stock has already moved more than its typical daily range, the odds of further continuation sharply decrease, while the risk of pullback or chop increases.
With this tool, you can:
🚫 Avoid chasing extended breakouts
🎯 Time entries before the real move
⚠️ Quickly assess risk/reward potential intraday
🧠 Example Use Case:
Imagine you're watching a classic VCP setup or flat base breakout. The stock breaks out on volume—but when you check this indicator, you see:
Today’s Move: 7.2%
Avg ADR: 5.3%
% of ADR: 135% 🟥
This tells you the stock is already well beyond its average daily range. While it may continue higher, odds now favor a consolidation, shakeout, or pullback. This is your cue to wait for a better entry or pass entirely.
On the flip side, if the breakout just started and the % of ADR is still under 50%, you have confirmation that there’s room to run — giving you more confidence to enter early.
⚙️ Fully Customizable:
Choose position on screen (top/bottom left/right)
Customize text color, background, and size
🔧 Install This Tool and:
✅ Stop chasing extended moves
✅ Add discipline to your entries
✅ Improve your breakout win rate
Perfect for VCP, CANSLIM, and BREAKOUT traders who want a clean, edge-enhancing visual guide.

Daily Movement AnalysisDaily Volatility Explorer: 7-Day Market Pulse Indicator
Unlock the hidden rhythms of market movements with this powerful analytical tool designed for both traditional and crypto traders. This indicator meticulously tracks and analyzes price volatility patterns across all seven days of the week, giving you a strategic edge in planning your trades.
🎯 Key Features:
• Dynamic 3-month rolling analysis of daily price movements
• Real-time volatility comparison across all trading days
• Clear visual representation through color-coded bar charts
• Detailed statistical table with exact pip movements
• Sample size tracking for statistical reliability
• Works seamlessly on both traditional and crypto markets
💡 Why Traders Need This:
1. Optimal Trade Timing
- Identify the most volatile trading days for maximum opportunity
- Discover the quietest days to avoid choppy markets
- Perfect for swing traders and day traders alike
2. Risk Management Enhancement
- Set smarter stop-losses based on typical daily ranges
- Adjust position sizes according to daily volatility patterns
- Avoid overtrading during historically low-volatility periods
3. Strategic Planning
- Plan your trading week around peak volatility days
- Optimize entry and exit points based on historical movements
- Better time management by focusing on the most active days
4. Market Psychology Insights
- Understand weekly market rhythm and institutional patterns
- Identify how weekend gaps affect crypto markets
- Spot changes in market behavior across different days
🔍 Perfect For:
• Forex traders tracking major currency pairs
• Crypto traders navigating 24/7 markets
• Gold and commodity traders
• Day traders optimizing their trading schedule
• Swing traders planning optimal entry/exit days
📊 Data-Driven Decisions:
The indicator maintains a rolling 3-month window of data, providing fresh, relevant insights while filtering out outdated patterns. Each day's analysis is based on actual market movements, giving you reliable, actionable intelligence for your trading decisions.
⚡ Pro Tip: Use this indicator alongside your existing strategy to enhance your trading plan and improve your timing. The color-coded visual system makes it easy to spot patterns at a glance, while the detailed statistics table provides the hard numbers you need for precise planning.
Remember: Markets evolve, and this indicator helps you stay on top of changing patterns in real-time. Whether you're trading traditional markets or crypto, understanding daily volatility patterns is crucial for consistent trading success.

Adaptive Fibonacci Volatility Bands (AFVB)
**Adaptive Fibonacci Volatility Bands (AFVB)**
### **Overview**
The **Adaptive Fibonacci Volatility Bands (AFVB)** indicator enhances standard **Fibonacci retracement levels** by dynamically adjusting them based on market **volatility**. By incorporating **ATR (Average True Range) adjustments**, this indicator refines key **support and resistance zones**, helping traders identify **more reliable entry and exit points**.
**Key Features:**
- **ATR-based adaptive Fibonacci levels** that adjust to changing market volatility.
- **Buy and Sell signals** based on price interactions with dynamic support/resistance.
- **Toggleable confirmation filter** for refining trade signals.
- **Customizable color schemes** and alerts.
---
## **How This Indicator Works**
The **AFVB** operates in three main steps:
### **1️⃣ Detecting Key Fibonacci Levels**
The script calculates **swing highs and swing lows** using a user-defined lookback period. From this, it derives **Fibonacci retracement levels**:
- **0% (High)**
- **23.6%**
- **38.2%**
- **50% (Mid-Level)**
- **61.8%**
- **78.6%**
- **100% (Low)**
### **2️⃣ Adjusting for Market Volatility**
Instead of using **fixed retracement levels**, this indicator incorporates an **ATR-based adjustment**:
- **Resistance levels** shift **upward** based on ATR.
- **Support levels** shift **downward** based on ATR.
- This makes levels more **responsive** to price action.
### **3️⃣ Generating Buy & Sell Signals**
AFVB provides **two types of signals** based on price interactions with key levels:
✔ **Buy Signal**:
Occurs when price **dips below** a support level (78.6% or 100%) and **then closes back above it**.
- **Optionally**, a confirmation buffer can be enabled to require price to close **above an additional threshold** (based on ATR).
✔ **Sell Signal**:
Triggered when price **breaks above a resistance level** (0% or 23.6%) and **then closes below it**.
📌 **Important:**
- The **buy threshold setting** allows traders to **fine-tune** entry conditions.
- Turning this setting **off** generates **more frequent** buy signals.
- Keeping it **on** reduces false signals but may result in **fewer trade opportunities**.
---
## **How to Use This Indicator in Trading**
### 🔹 **Entry Strategy (Buying)**
1️⃣ Look for **buy signals** at the **78.6% or 100% Fibonacci levels**.
2️⃣ Ensure price **closes above** the support level before entering a long trade.
3️⃣ **Enable or disable** the buy threshold filter depending on desired trade strictness.
### 🔹 **Exit Strategy (Selling)**
1️⃣ Watch for **sell signals** at the **0% or 23.6% Fibonacci levels**.
2️⃣ If price **breaks above resistance and then closes below**, consider exiting long positions.
3️⃣ Can be used **alone** or **combined with trend confirmation tools** (e.g., moving averages, RSI).
### 🔹 **Using the Toggleable Buy Threshold**
- **ON**: Buy signal requires **extra confirmation** (reduces false signals but fewer trades).
- **OFF**: Buy triggers as soon as price **closes back above support** (more signals, but may include weaker setups).
---
## **User Inputs**
### **🔧 Customization Options**
- **ATR Length**: Defines the period for **ATR calculation**.
- **Swing Lookback**: Determines how far back to find **swing highs and lows**.
- **ATR Multiplier**: Adjusts the size of **volatility-based modifications**.
- **Buy/Sell Threshold Factor**: Fine-tunes the **entry signal strictness**.
- **Show Level Labels**: Enables/disables **Fibonacci level annotations**.
- **Color Settings**: Customize **support/resistance colors**.
### **📢 Alerts**
AFVB includes built-in **alert conditions** for:
- **Buy Signals** ("AFVB BUY SIGNAL - Possible reversal at support")
- **Sell Signals** ("AFVB SELL SIGNAL - Possible reversal at resistance")
- **Any Signal Triggered** (Useful for automated alerts)
---
## **Who Is This Indicator For?**
✅ **Scalpers & Day Traders** – Helps identify **short-term reversals**.
✅ **Swing Traders** – Useful for **buying dips** and **selling rallies**.
✅ **Trend Traders** – Can be combined with **momentum indicators** for confirmation.
**Best Timeframes:**
⏳ **15-minute, 1-hour, 4-hour, Daily charts** (works across multiple assets).
---
## **Limitations & Considerations**
🚨 **Important Notes**:
- **No indicator guarantees profits**. Always **combine** it with **risk management strategies**.
- Works best **in trending & mean-reverting markets**—may generate false signals in **choppy conditions**.
- Performance may vary across **different assets & timeframes**.
📢 **Backtesting is recommended** before using it for live trading.

Fractal Breakout Trend Following System█ OVERVIEW
The Fractal Breakout Trend Following System is a custom technical analysis tool designed to pinpoint significant fractal pivot points and breakout levels. By analyzing price action through configurable pivot parameters, this indicator dynamically identifies key support and resistance zones. It not only marks crucial highs and lows on the chart but also signals potential trend reversals through real-time breakout detections, helping traders capture shifts in market momentum.
█ KEY FEATURES
Fractal Pivot Detection
Utilizes user-defined left and right pivot lengths to detect local highs (pivot highs) and lows (pivot lows). This fractal-based approach ensures that only meaningful price moves are considered, effectively filtering out minor market noise.
Dynamic Line Visualization
Upon confirmation of a pivot, the system draws a dynamic line representing resistance (from pivot highs) or support (from pivot lows). These lines extend across the chart until a breakout occurs, offering a continuous visual guide to key levels.
Trend Breakout Signals
Monitors for price crossovers relative to the drawn pivot lines. A crossover above a resistance line signals a bullish breakout, while a crossunder below a support line indicates a bearish move, thus updating the prevailing trend.
Pivot Labelling
Assigns labels such as "HH", "LH", "LL", or "HL" to detected pivots based on their relative values.
It uses the following designations:
HH (Higher High) : Indicates that the current pivot high is greater than the previous pivot high, suggesting continued upward momentum.
LH (Lower High) : Signals that the current pivot high is lower than the previous pivot high, which may hint at a potential reversal within an uptrend.
LL (Lower Low) : Shows that the current pivot low is lower than the previous pivot low, confirming sustained downward pressure.
HL (Higher Low) : Reveals that the current pivot low is higher than the previous pivot low, potentially indicating the beginning of an upward reversal in a downtrend.
These labels provide traders with immediate insight into the market structure and recent price behavior.
Customizable Visual Settings
Offers various customization options:
• Adjust pivot sensitivity via left/right pivot inputs.
• Toggle pivot labels on or off.
• Enable background color changes to reflect bullish or bearish trends.
• Choose preferred colors for bullish (e.g., green) and bearish (e.g., red) signals.
█ UNDERLYING METHODOLOGY & CALCULATIONS
Fractal Pivot Calculation
The script employs a sliding window technique using configurable left and right parameters to identify local highs and lows. Detected pivot values are sanitized to ensure consistency in subsequent calculations.
Dynamic Line Plotting
When a new pivot is detected, a corresponding line is drawn from the pivot point. This line extends until the price breaks the level, at which point it is reset. This method provides a continuous reference for support and resistance.
Trend Breakout Identification
By continuously monitoring price interactions with the pivot lines, the indicator identifies breakouts. A price crossover above a resistance line suggests a bullish breakout, while a crossunder below a support line indicates a bearish shift. The current trend is updated accordingly.
Pivot Label Assignment
The system compares the current pivot with the previous one to determine if the move represents a higher high, lower high, higher low, or lower low. This classification helps traders understand the underlying market momentum.
█ HOW TO USE THE INDICATOR
1 — Apply the Indicator
• Add the Fractal Breakout Trend Following System to your chart to begin visualizing dynamic pivot points and breakout signals.
2 — Adjust Settings for Your Market
• Pivot Detection – Configure the left and right pivot lengths for both highs and lows to suit your desired sensitivity:
- Use shorter lengths for more responsive signals in fast-moving markets.
- Use longer lengths to filter out minor fluctuations in volatile conditions.
• Visual Customization – Toggle the display of pivot labels and background color changes. Select your preferred colors for bullish and bearish trends.
3 — Interpret the Signals
• Support & Resistance Lines – Observe the dynamically drawn lines that represent key pivot levels.
• Pivot Labels – Look for labels like "HH", "LH", "LL", and "HL" to quickly assess market structure and trend behavior.
• Trend Signals – Watch for price crossovers and corresponding background color shifts to gauge bullish or bearish breakouts.
4 — Integrate with Your Trading Strategy
• Use the identified pivot points as potential support and resistance levels.
• Combine breakout signals with other technical indicators for comprehensive trade confirmation.
• Adjust the sensitivity settings to tailor the indicator to various instruments and market conditions.
█ CONCLUSION
The Fractal Breakout Trend Following System offers a robust framework for identifying critical fractal pivot points and potential breakout opportunities. With its dynamic line plotting, clear pivot labeling, and customizable visual settings, this indicator equips traders with actionable insights to enhance decision-making and optimize entry and exit strategies.
