Point of possible Reversal (PPR): forex Strategypoint of possible Reversal, PPR :
in this strategy I have tried to find out the possible Reversal points in the forex pairs. It’s the most resisted levels from where the trend takes up a particular direction. These PPR can lead the price in any direction depending upon the time zone its happening in.
In this strategy once the code finds a PPR it then checks for suitable time zone then it checks for the RSI confirmation, it checks for the Parkinson Volatility, it checks for internal Bar Strength (refer below for more information)
The following setting details will help you in the understanding the strategy and indicator used:
This indicator contains the following setting:
1.Fixed trading sessions for Long and Short
i. Fixed trading session for long trades (long position can be taken in that period of time only)
ii. Fixed trading session for short trades (Short position can be taken in that period of time only)
The concept behind restricting the time to go long or short is because in forex the particular pair move in a particular direction depending upon the currency and time zones.
This strategy works on different forex pairs, you need to find the best settings. I will be providing the best settings which works for this strategy and different pairs.
2.Setting for back test selection date range you can check the beck test of a particular time range.
3.You can check Long and Short positions performance separately, by unchecking the “ Go_long ” option it will remove all long positions from back test. Vice versa for “ Go_short "option
4.Internal Bar Strength
IBS is simply an indicator where you buy on weakness and sell on strength, the cornerstone of any mean-reverting strategy.
It oscillates from zero to one and measures the relative position of the closing price relative to the High and Low.
IBS = (Close – Low) / (High – Low)
In the input setting the you can disable enable the IBS option from the strategy.
5. Parkinson volatility
Parkinson volatility is a volatility measure that uses the stock’s high and low price of the day (can be changed in the setting, instead of day it can be set to any bar length)
The main difference between regular volatility and Parkinson volatility is that the latter uses high and low prices for a day, rather than only the closing price.
In the setting you have three option
1. Enter Volatility Threshold
If the Parkinson volatility value is greater than the the threshold value then it lets the trade happen.
2.Set the high/low bar time frame for calculating Parkinson volatility. ( Set 60m by default)
Formula used as below:
high_=security(syminfo.ticker, input("60"), high)
low_=security(syminfo.ticker, input("60"), low)
hourlyRangeSquared = pow((log(high_) - log(low_)), 2)
dailyParkinsonVol = sqrt(sum(hourlyRangeSquared, 24) / (4 * log(2)))
6. "Enter no of contract size"
This setting helps you to set the contract size , by default it is set to 100000.
7.This setting is for the PPR, in this you can change the search of PPR in another time frame, you can add higher timeframe PPR in the chart, by default the PPR is set to search for current time frame PPR.
8.Futrther confirmation of trade is done through the RSI criteria . In this I have provided four kind of RSI confirmation you can test all by selecting any one of the four.
1. filter trade on the basis of BB of RSI (as shown in the image)
2. filter trade on the basis of RSI Levels (RSI>50 for long, vice versa for short)
3. filter trade by rsi>basis of BB of RSI(for long) & rsi<50(for short)
4. filter trade by rsi>50(long) & rsi< basis of BB of RSI(short)
SELECT ONLY ONE OF THE ABOVE IN SETTING.
9.For Exiting the trade I have used the trailing SL you can change it in setting.
You can exit the trade using two targets (two take profit) using different size for editing the trade.
If you want to take only on target then you have to make QANTITY of shares for 1st Exit as 100. Then you will exit all your position in the first target achieved.
A big thanks to kodify.net there articles are very helpful kodify.net
Thanks to stack overflow community for clearing the doubts.
Thanks to Mickey for providing assistance.
Trading view official documentation on V4 of pine script also helped me.
Soporte y resistencia

Break of structure (BOS) forex StrategyPlease read all Details before using this indicator
This strategy is based on taking position after the break of a Previous High/Low swing happens (fixed time frame), the break of structure happens because of the swing happens then we go long or short respectively in this strategy.
I will be discussing the setting details through which you can make it work on different forex pairs.
Does it work on other pairs?
Yes, I have found similar back test results on other USD pairs.
Does it works on smaller time frame?
Yes it does work on smaller time frame , you have to understand the below concepts used and try different settings.
For the user the most important thing is to understand the settings of the indicator so that they can optimize the setting and get the best results:
This indicator contains the following IMPORTANT setting:
i. Fixed trading session for long trades (long position can be taken in that period of time only)
ii. Fixed trading session for short trades (Short position can be taken in that period of time only)
The concept behind restricting the time to go long or short is because in forex the particular pair move in a particular direction depending upon the currency and time zones.
This strategy works on different forex pairs, you need to find the best settings. I will be providing the best settings which works for this strategy and different pairs.
2. Choose Previous High/Low Timeframe
This is the most important option where you have to choose the timeframe for which you want H/L by default it is set to “D”. This timeframe H/L reference will be taken for taking trading decisions.
3.Setting for back test selection date range you can check the beck test of a particular time range.
4.You can check Long and Short positions performance separately, by unchecking the “Go_long” option it will remove all long positions from back test. Vice versa for “Go_short option”
5.Internal Bar Strength
IBS is simply an indicator where you buy on weakness and sell on strength, the cornerstone of any mean-reverting strategy.
It oscillates from zero to one and measures the relative position of the closing price relative to the High and Low.
IBS = (Close – Low) / (High – Low)
In the input setting the you can disable enable the IBS option from the strategy.
6. Parkinson volatility
Parkinson volatility is a volatility measure that uses the stock’s high and low price of the day (can be changed in the setting, instead of day it can be set to any bar length)
The main difference between regular volatility and Parkinson volatility is that the latter uses high and low prices for a day, rather than only the closing price.
In the setting you have three option
i. Enter Volatility Threshold
If the Parkinson volatility value is greater than the the threshold value then it lets the trade happen.
ii.Set the high/low bar time frame for calculating Parkinson volatility. ( Set 60m by default)
Formula used as below:
high_=security(syminfo.ticker, input("60"), high)
low_=security(syminfo.ticker, input("60"), low)
hourlyRangeSquared = pow((log(high_) - log(low_)), 2)
dailyParkinsonVol = sqrt(sum(hourlyRangeSquared, 24) / (4 * log(2)))
7. "Enter no of contract size"
This setting helps you to set the contract size , by default it is set to 100000.
8. “Zigzag Filter Length” this setting is for SWING H/L Lookback. With the help of this I have ploted Swing Support and Resistance.
9.Futrther confirmation of trade is done through the RSI criteria. In this I have provided four kind of RSI confirmation you can test all by selecting any one of the four.
i. filter trade on the basis of BB of RSI (as shown in the image)
ii. filter trade on the basis of RSI Levels (RSI>50 for long, vice versa for short)
iii. filter trade by rsi>basis of BB of RSI(for long) & rsi<50(for short)
iv. filter trade by rsi>50(long) & rsi< basis of BB of RSI(short)
SELECT ONLY ONE OF THE ABOVE IN SETTING.
10.For Exiting the trade I have used the trailing SL you can change it in setting.
You can exit the trade using two targets (two take profit) using different size for exiting the trade.
If you want to take only on target then you have to make QANTITY of shares for 1st Exit as 100. Then you will exit all your position in the first target.
A big thanks to kodify.net there articles are very helpful kodify.net
Thanks to Mickey for providing assistance.
Thanks to stack overflow community for clearing the doubts.
Trading view official documentation on V4 of pine script also helped me.

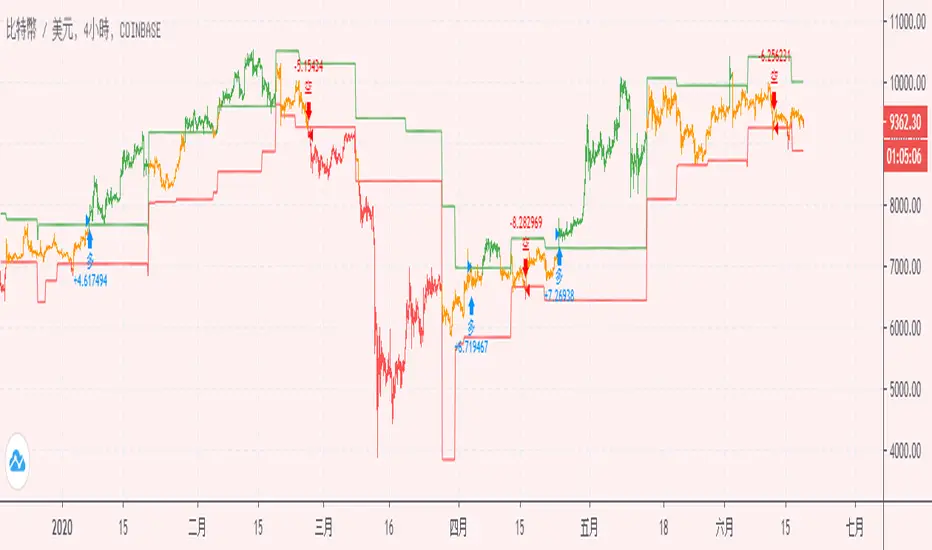
hamster-bot PDD Pump and Dump DetectorPump and Dump detector by hamster-bot
strategy author: foresterufa
Pump and Dump detector (PDD)
This is a trend strategy, with a unique mechanism of multi-stage re-entry into a position (Take Profit-Entry) when a significant trend develops, based on our HiDeep indicator.
Positions are opened by the HiDeep indicator signal with trend direction filtering and volatility filtering. Positions are closed by a HiDeep indicator signal or a change in the trend direction.
The position can be accompanied by a unique Stoploss trailing MA.

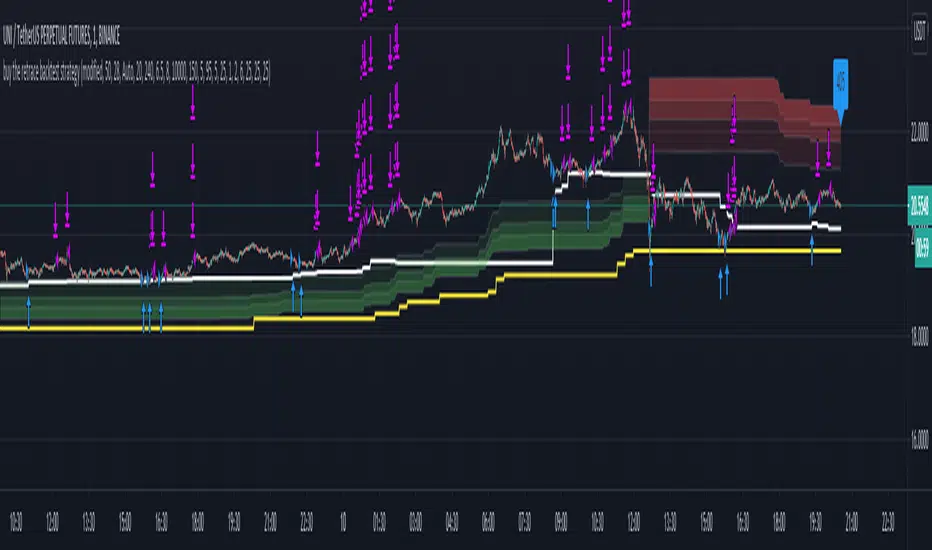
Buy The Retrace backtest strategyA trend-following strategy entering pullbacks
Simple but efficient
Mostly used it on 1 min chart but it works extremely well on 5 min as well.
The components of the strategy:
-MTF ATR based Trend
-Fib based cloud to help determine the trend - Caution when trend and cloud shows a different trend - a reversal may be possible.
-Optional values for the signals -how often you would like to get one- can be changed based on - the current close relative to the close-only high-low range over a given period of time.
-3x take profit levels
- all adjustable in %
- take profit quantities adjustable in % for each level
-paints a line where your average position is
-labels the current position size
Be careful where the cloud is broken, a reversal may happen.
Be careful longing / shorting the same levels which acted as a support/resistance before - this is why the win ratio is around 80% only as a small percentage gets stopped out usually.
Would like to get access? Pm me I'll grant it.
trendOne [Strategy]BITSTAMP:BTCUSD
trendOne
(strategy-tester)
It is not recommended to use this script for generating alerts. Use "trendOne Alerts" instead.
This script combines all our previous trend-based scripts (Bows, Autopilot, Trend Indicator, Price Deviation, etc) in only one script .
To calculate the trend we use:
Volume Weight
Average True Range
Bows calculations
Trends smoothed with alma() function.
For more accuracy on the signals and to filter unwanted signals we layered slower time-frames in the background and added breaking support & resistance rules.
Inputs
Sensitivity
Integer input. Sets the sensitivity for signals generated up and down. Higher values will generate less signals on chart, and vice-versa.
Enjoy!
Disclaimer:
Back-tests do not guarantee performance on the future. Even if a trading setup is profitable in historical data, it could be unprofitable in the future.
To get access to this and other scripts check links below.

alGROWithm Premium - Strategy TesterThe alGROWithm Strategy Tester is a supplement to the original alGROWithm indicator.
Use this strategy to do your own back testing and find the best settings that work for your asset of choice.
█ WHY THIS IS IMPORTANT
Different assets require different settings for optimal results. This strategy script will allow you back test different settings for alGROWithm in order to analyze key metrics such as win rate and P/L. TradingView functionality also enables you to view a high level performance summary and even see every single individual trade made by the algo.
█ BEST PRACTICES
Depending on the asset you are testing, it is very important to update the settings as needed. For example, if you are back testing on US30, you will likely need to increase the starting capital. For other assets, you may also need to change the order size to use the Contracts option.
It is important to decide for yourself which back testing parameter you will weigh more heavily in terms of importance. For example, a day trader may want to use a setting that maximizes win rate rather than profit % since we are humans and not computers. Further, it is highly recommended to utilize all of the rich features that TradingView provides with regards to back testing. For example, using the List of Trades tab, go back to find a failed trade and analyze the trade to see if you actually would have taken it in the moment.
After finding the best sensitivity for your asset, it is important to set that sensitivity value on the non-strategy version of alGROWithm for usage. Changing settings on this version will not carry over to the non-strategy version.
█ DEFAULT SETTINGS
We have set the following default settings on the strategy:
Starting capital: $100k
Order size: 30% of equity
Sell 1/5 of position every Take Profit level

[SATS]Foreca$ter Backtester **This is Backesting version of Foreca$ter Indicator. Access of backtester will be gained together with access of Foreca$ter**
Foreca$ter is an indicator design for trend trading.
Description:
Foreca$ter is originally design for trend trading, but with the timeframe focus on lower timeframe eg: 15mins, 5mins and lower, it can be used as indicator scalping.
There are symbol in Foreca$ter indicator that preview on the where next possible Buy/Sell signal might be generated and pay attention on it.
In the setting, multiple signal can be toggle on to shows multiple signal that generated. It also provide the ability to set SL and multiple TP targets for alert setting.
The algorithm is based on multiple aspect to signal Buy and Sell signal. Below are the aspect behind.
-Determine support resistance on higher time frame using pivot level.
-Multiple EMAs cross are use for trend determination.
-On lower timeframe, breakout of support or resistance follow by trend confirmation to signal Buy and Sell
-The signals are ticker specified and there is fine tuned between different tickers and timeframe. Therefore it only works on the specified tickers and timeframe in the sysmbol.
User Manual:
Symbol: You must match the symbol with the pairs and timeframe for it to works. Eg: For "Binance: BTCUSDTPERP 15mins" you need to set the ticker as Binance: BTCUSDTPERP and set timeframe to 15mins
Show Info Panel: Toggle on and off of info panel.
Multiple Entry: Toggle on to generate signal whenever the condition are met. This give you next possible entry if you missed the current one.
Customizable stoploss and multiple take profit target
Alert for Buy/Sell, SL and multiple TP
Current support pairs:
-BTCUSDTPERP 15mins
-BNBUSDTPERP 15mins
-LINKUSDTPERP 15mins
-LINKUSDTPERP 5mins
-LINKUSDTPERP 3mins
Remarks:
- Foreca$ter is continuous develop on new pairs and on different timeframe.
DM us in TV or our Discord for access to the indicator.

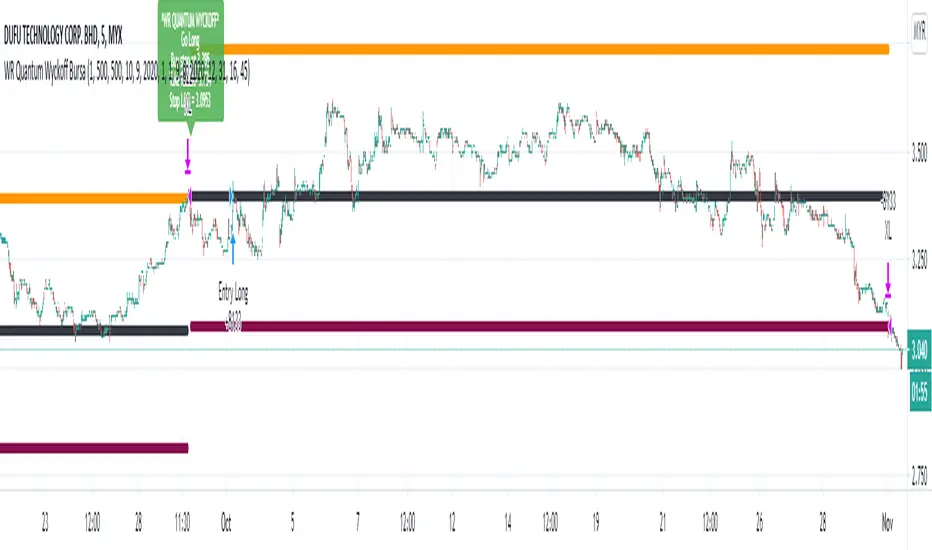
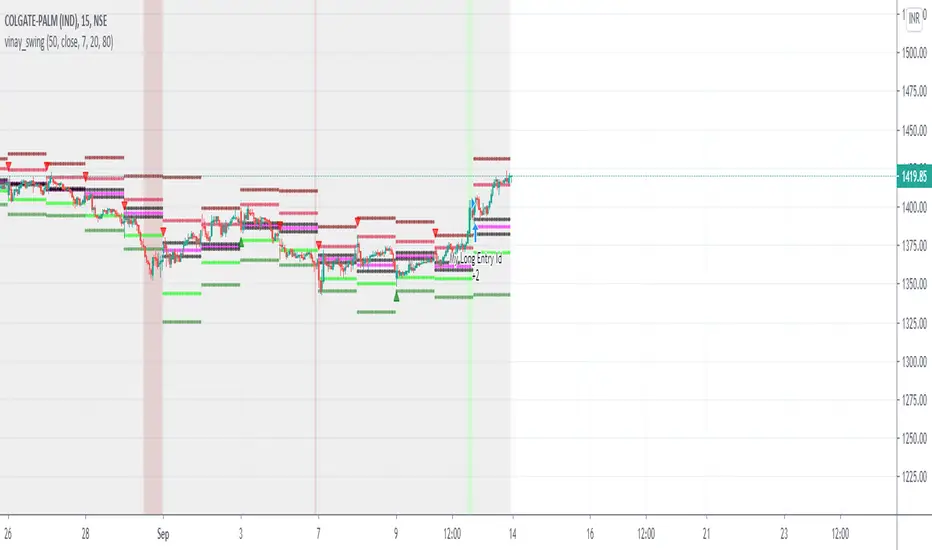
WR Quantum Wyckoff Bursa BacktestBURSA Malaysia trading robot alert is built based on WR Quantum Wyckoff Technique strategy.
The back test strategy is suitable to use in BURSA Saham.
The script will identify accumulation candle (box) at specific timeframe and will advice entry value and calculate advice take profit and stop loss based on % settable in the preset.
Once entry is confirm, script will popup one label with detail of Long Entry Condition.
This is an example of Indicator for Long Entry Condition:
ibb.co
This is setting for user to adjust to get best result for BURSA Counter:
ibb.co
User is given flexibility to adjust :
1. Date and Time Range for back test
2. Intraday or Swing strategy (Intraday - Intraday Box is selected, Swing - Intraday Box is not selected)
3. Take Profit % setting
4. Stop Loss % setting
Disclaimer:
This is a stock trading strategy that involves high risk of equity loss, You agree to use this script at your own risk.
If you have any suggestions, comments or interested to use this script, kindly PM us to obtain an access.
Algonize Pivot Strategy (APS)This study is based on several Price Action parameters of :-
• Pivot Points,
• Higher High and Lower Lows,
• High Low Index ,
• Support and Resistance.
► How To Use This Strategy?
This is a pure scalping strategy and it is advised to use this only with algo trading systems. Due to high trade frequency.
► This Strategy has inbuilt custom time frame backtester, which enables you to test for performance between any date or check for a single day.
► To Create Alerts for algo trading in this strategy simply Check "Activate Algo" from Settings then Create new alert , select your strategy in condition box, and now scroll down to message box and write
{{strategy.order.comment}}
That's it , Just Click on Create Alert Button
Backtest Values Used:-
Initial Capital : 1000000
Order Size (Lots) : 1 (Contract) Lots
Pyramiding : 0 orders
Commission : 0.003%
Sharpe Ratio : 1.741
Profit Factor : 1.174
Test Yourself and give feedback.
PM us to obtain access.

Swing Index System - Heiken Ashi Pivot Breakout StrategyFor Educational Purposes. Results can differ on different markets and can fail at any time. Profit is not guaranteed.
This only works in a few markets and in certain situations. Changing the settings can give better or worse results for other markets. This is a breakout strategy that uses the heiken ashi bars to find the support and resistance levels or the swing pivots to try to objectively find a breakout. When the price breaks out of a swing pivot, breakout can be confirmed and a strategy can be made. The trade exits as soon as in profit when the heiken ashi bar changes color, when the price swings start to slow down, or when the price breaks below a swing pivot. There might be many strategies and possible ideas that can be made just from knowing where the swing pivots are alone. For this one, I decided to try to emulate Wilder's Adam Theory approach by entering only a specific criteria when it makes new highs or lows that I experimented with. The Swing Index System seems to be similar to what he describes in his book (or perhaps it is the same thing).
Some say that price is the ultimate indicator, but not many really know what that really means. This is yet another approach to try to interpret what that means. This strategy only contains a piece of the complete breakout and trend strategy approach of the Adam Theory and won't be profitable in every market under every situation. This does not include price patterns that the Swing Index System is said to be able to find such as chart patterns, wedges, tops/bottoms, etc. This only includes the small breakout portion requirement in the book. I included specific entry and exit criteria to make the strategy work well that involves nothing but the price action of the swing points only due to the lack of the other missing pieces. It does not contain the missing pieces. Despite this, it can still help find where breakouts might be in an objective matter using the Swing Index System as a standalone trading system and it doesn't involve lookbacks or anything but price alone.

2 Candles Inside ATR2 agitated candles falling inside ATR range, awaiting possibly a big move.
Buy / Sell signals at combined high / low can be used as order with other as stop loss.
Counter trade, when this minimal stop loss is hit, is also as useful. However, wait till the SL candle closes, before opening position on the other side.
Works quite well on 15 mins chart, with settings of ATR duration 25 and multiplier 0.6. These settings are configurable, so feel free.

Automated - Fibs with Market ordersThis script was recently shared for limit only orders here:
This version does not worry about keeping orders in the books and moving them around, instead it will simply market in and out.
I am sharing this to reveal the difference between the 2 setups.

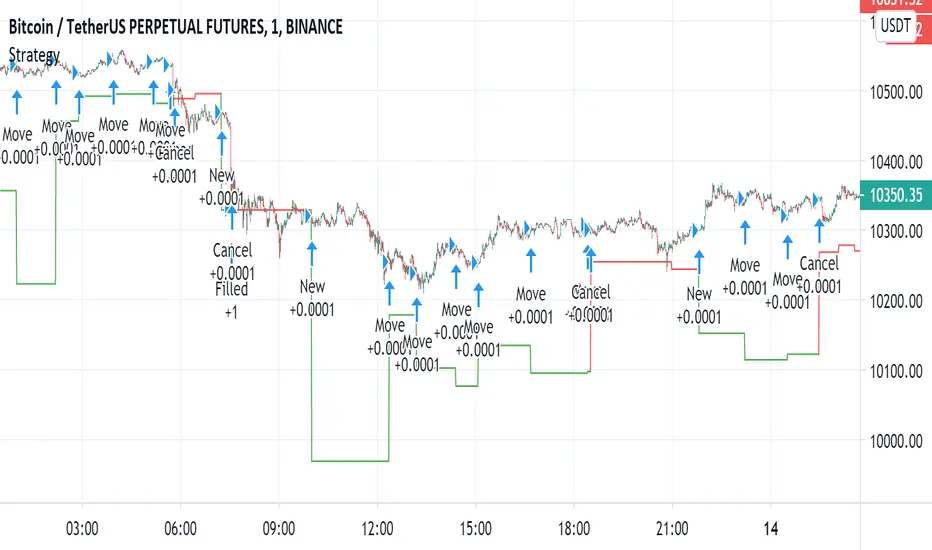
Automated - Fibs with Limit only ordersAutomated - Fibs with Limit only orders
This script was designed to demonstrate how you can use a single alert to move your limit orders around.
It is not meant to be traded live and has been built to work with Binance Futures Testnet.
You will notice a lot of plots with 5 different titles.
New = Place your limit buy at a fixed-price.
Move = Cancel the current limit buy and place it at the new fixed-price.
Filled = Cancel any limit closes and places them anew based on the new average and take profit.
Cancel = Cancels exisiting limit buys.
Cloes All = Limit close filled, no commands necessary.
The default quantity in the command is the minimum order size on Binance.
Settings
Live
- If enabled it will only place trades after the "Stat Timestamp + Start Delay" that you provide.
Start Timestamp
- Use something similar to epochconverter to get the current timestamp.
Start Delay
- Gives you 1 minute by default to start the script and create your alert before it begins looking for a new entry.
Leverage
- Default 1. Affects the "Take Profit and DCA When" Settings.
Take Profit %
- This is the percentage above the current average you'd like to place your position close at.
DCA When %
- The percentage below your last entry that you're willing to buy again.
Note: This strategy has no stop-loss and pyramiding is enabled. It is not built for, or recommended to run live.
I hope this opens some doors and helps advance your personal trading system.
Good luck and happy scripting!
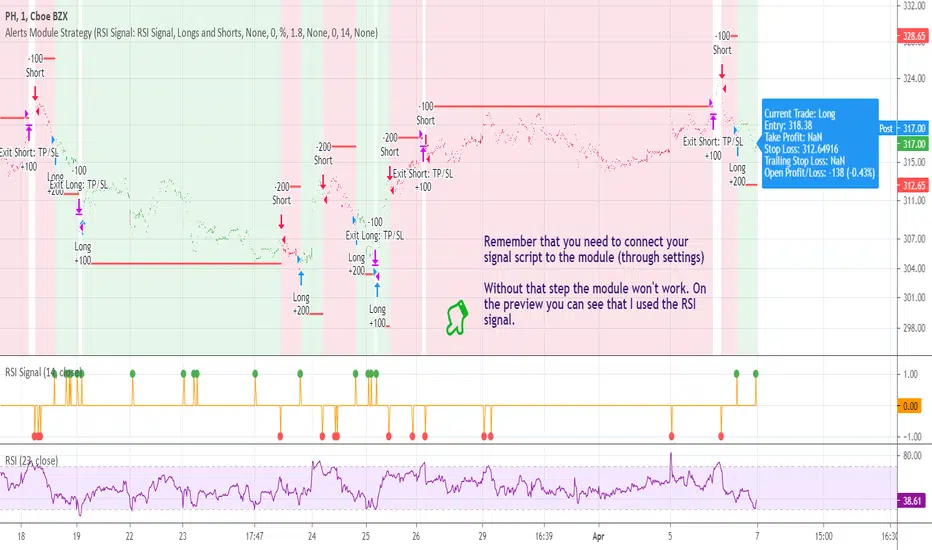
[STRATEGY] Buy/Sell/TP/SL/TSL Alerts ModuleA strategy version of the Buy/Sell/TP/SL/TSL Alerts Module .
It works the same way:
1) You choose a specific indicator and apply it to your chart
2) You create a special signal form of that indicator
3) You connect that form to the module
4) Bob's your uncle
If you have any questions don't hesitate to ask and contact me either via private messages on TradingView or via Telegram.
Thanks!
swing tradeTHIS strategy is based on the
franklin ochao swing trade book
confirmed bullish - when ever stock closed above R2 (more bullish)
when ever stock closed between R1 AND R2 (moderatly bullish or consolidation phase with respect to previous trend)
entry1 for more bullish trend is buy at every dips means when ever price low below pivot when it open above the pivot
entry2 for more bullish trend is buy at low is below s1
keep strictly stoploss at s1 of previous day (r2 close day)
trend reversal is possible once stock close below s1 in 1hr time frame
virgin cpr or missed pivot is added a advantage
For bearish mode this vice verse
Cyatophilum Levels [BACKTEST]Cyatophilum Levels - Version 1.0 - Backtest
This indicator allows you to build your own strategy based on Fibonacci levels, and see the backtest results in the Strategy Tester.
The Fibonacci levels are printed automatically in real time and without repainting on the chart.
You configure your own strategy in the indicator parameters. You can choose to go long or to go short, or both, on which Fib levels to enter Long/Short, and on which Fib levels to exit (up to 2 entry levels and exit levels).
Detailed Guide:
This is a guide that can be useful if you do not understand the strategy or an indicator parameter. Instructions on how to get access are at the bottom.
To configure your strategy, you need to open the indicator settings. You can either right-click on the indicator and click "settings", or click the settings button near the indicator's name.
You should know that the Fibonnaci levels are calculated from the support and resistance levels, which are calculated using the last swing high and swing low. This behavior can be tweaked in the settings with the first 2 parameters:
· Noise reduction
Dropdown menu. Options are "NONE", "SMALL", "MEDIUM", "HUGE". Used to get a smoother level behavior. The higher it is, the less often the support and resistance levels will move. Can be useful to cut off fakeouts.
· Swings lookback
This is the number of historical bars used to calculate the last swing high and swing low.
In TradingView, we usually wait bar close to validate a signal (trade entry or exit), in order to avoid repainting. But since this indicator is purely based on price action, there is an option called Alert Type if you want to receive intra-bar alerts or not.
· Entry Alert Type
2 options : "Once Per Bar Close", "Once Per Bar". These correspond to the alerts options. You must use the same alert type in the indicator settings and in the alert options. When using "Once Per Bar", the candle high and low are used for the cross conditions, otherwise, candle close is used.
· Exit Alert Type
Same but for exit alerts.
The long trades setup can be configured independantly from the short trade setup, but the parameters are the same.
■ Go Long/Short
Check this box to enable/disable long/short trades.
· Long/Short Entry Condition
Dropdown menu from which you can pick the condition for your entry. Options available are "Cross Over","Cross Under" and "Just Cross".
· Long/Short Entry 1
Dropdown menu from which you can pick the level for your entry n°1. Options available are "Support","FIB 23", "FIB 38", "FIB 50","FIB 61","FIB 78" and "Resistance".
· Long/Short Entry 2
Additional FIB level entry.
· Long/Short Exit 1
Dropdown menu from which you can pick the level for your exit. Options available are "Support","FIB 23", "FIB 38", "FIB 50","FIB 61","FIB 78" and "Resistance".
· Long/Short Exit 2
Additional FIB level exit.
■ Trend Filter
Optionnal Tilson T3 TrendLine to make the strategy go long only when price is above T3 (green) and short only when price is below (red). The length in bars is configurable.
· Backtest period
The day of the start and end period of the backtest can be configured, as long as it is included in the available chart data which is around 20 000 candles. For example a 3 minutes chart data is around 41 days. (20000x3/60/24 = 41.3)
· Limit orders
By default the strategy tester uses market orders. With this option you can simulate limit orders with a limit price.
· Configuration Panel
It should appear on the left of the chart. This panel displays the whole indicator settings in a compact and easy-to-read way. You can replicate a strategy from just this info panel. Can be turned off if needed.
· Graphic options
A red/green background corresponding to the strategy position (short/long) can be turned off.
The Fib levels labels can be turned off all at once.
Backtesting Guide:
To open the backtest parameters, open the indicator settings and go to the "properties" tab.
The commission is set by to 0.1 % by default. You can change it to suit your exchange's fees.
Futures, Forex:
- The Order Size must be set to "contracts", or else you will get "no data".
Stocks, CFD, Cryptocurrency, Index:
- Both "% equity" and "contracts" can be used as Order Size.
Note: the net profit percentage is related to the initial capital set in the backtest properties.
Risk management
Place your secondary exit one or two levels above/below your entry to act as a stop loss.
Backtest Settings:
· Initial Capital: 10 000 $
· Order Size: 5 000 contracts
· Commission : 0.1€ per order (total commission paid: 20.00 €)
Oldest trade: 2019-10-01
Backtest Period: From 2019-10-01 to 2020-07-14
Default settings set for 15m.
Use the link below to obtain access to this indicator

[LunaOwl] Support Resistance Strategy V4作品: 支撐壓力策略
A simple Support Resistance Breakthrough Strategy, the only difference is that it is PineScript @version=4. interested parties can use it as a reference.
Its logic is simple, wish your all the best.
一個簡單的支撐阻力突破策略,唯一的差異,在於它是PineScript第四版。有興趣的可以拿來當作參考,簡易的指標。祝你們順心。
Support level refers to the support price that the exchange rate may encounter when it falls, so as to stop falling and stabilize the price.
The corresponding concept is the resistance level, that is, the pressure that the exchange rate may encounter when it rises, thus reversing to a falling price.
支撐位是指匯價在下跌時可能遇到的支撐價格,從而止跌回穩的價格,對應的概念是阻力位,也即匯價上漲時可能遇到的壓力,從而反轉為下跌的價格。
Support/ Resistance with H1 ATR - strategy mainline versionThis script using ATR (average true range) with source hl2 for create Support/ Resistance line
The color meaning:
- Green = Support line
- Red = Resistance line
Signal:
- If close price breakout Resistance line -> LONG signal will been active.
- If close price breakout Support line -> SHORT signal will been active.
Input setting:
Recommended default setting.
- Factor: amplitude for create Support/ Resistance line.
- Length: length of ATR.
- Offset: number of bar for check sideway or choppy market.
- Take profit: if you want test close position by profit.
- Stop loss: should not be missed.
- Open Position with Stop-Market type:
+ Open LONG position with high price and type Stop-Market.
+ Open SHORT position with low price and type Stop-Market.
Strategy setting:
Recommended default setting if you trade on Binance Futures or change Comission if you trade on another exchange.
Best backtest if:
- Max drawdown less than 10%.
- Min backtest time: 6 month.
- Avg profit: 10%/ month when no leverage is used.
Alert version:
1 - Select create new alert
2 - Condition:
+ eb BUY -> LONG signal
+ eb BUY close -> close LONG position
+ eb SELL -> SHORT signal
+ eb SELL close -> close SHORT position
3 - Option: recommended using only. Because the signal will be more accurate if the price close breakout successfully.
+ Always put stop loss position to avoid PUMP/ DUMP market.
// Note: alert version not free, send for me a private message on TradingView to get price and gain access.
Recommended:
- Using in M30, M45, H1 timeframe with default setting.
- Symbol: BTC
- Exchange: Binance Futures
- Order size: 10% wallet balance, maximum 25% wallet balance.
- Leverage: X2-X5, maximum X10.
---> I using 10% wallet balance and X2 only.

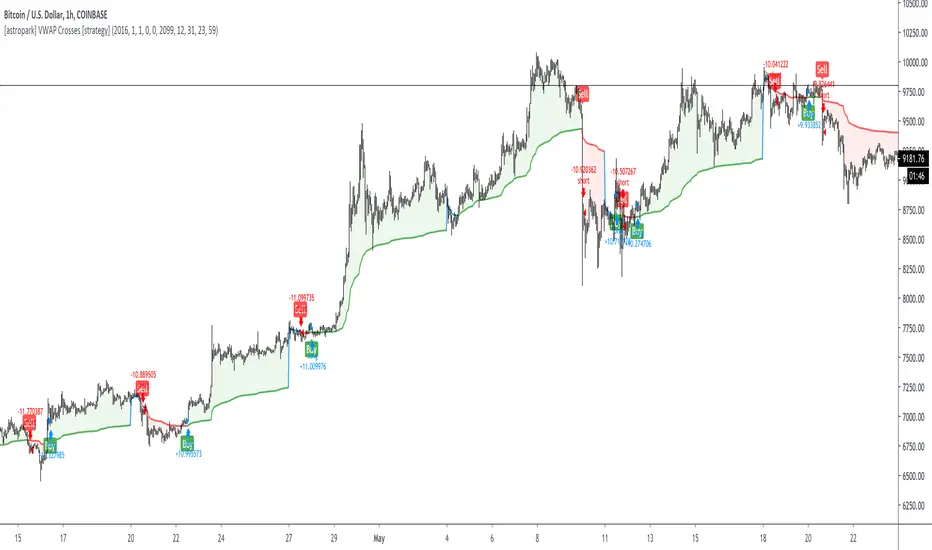
[astropark] VWAP Crosses [strategy]Dear Followers,
today a new Swing and Scalping Strategy based on WVAP , mainly designed for Bitcoin and High-Cap Cryptocurrencies, like Ethereum. It works also on Forex and Stocks.
It works great since 15m and above till 1D. I suggest you to use it on 15m, 30m or 1h timeframes .
VWAP or "Volume Weighted Average Price" is a volume-based indicator similar to a moving average.
This trading indicator is used to identify market resistance and support levels and is represented as a weighted average price for the treaded volumes.
My strategy will help you identify main support-resistance level to be careful of and it will trigger a buy or a sell depending on how price will intereact with vwaps.
green means we are in a bullish trend, in fact it start with a "buy" signal
red means we are in a bearish trend, in fact it start with a "sell" signal
blue means we are in a moment where trend may change, so be careful and always remember that taking profits is awesome and have a stoploss is a must in trading
The user who wants to use this strategy, especially via an automated bot, must always set a stoploss (example 150$ from entry on bitcoin) or use a proper risk management strategy .
This is not the "Holy Grail", so use it with caution. It's highly suggested to use a proper money management .
This script will let you backtest this script and check profitability on your preferred market.
The alarms version of this indicator, which will let you set all notifications you may need in order to be alerted on each triggered signals, can be found by searching for astropark "VWAP Crosses"
This is a premium indicator , so send me a private message in order to get access to this script.
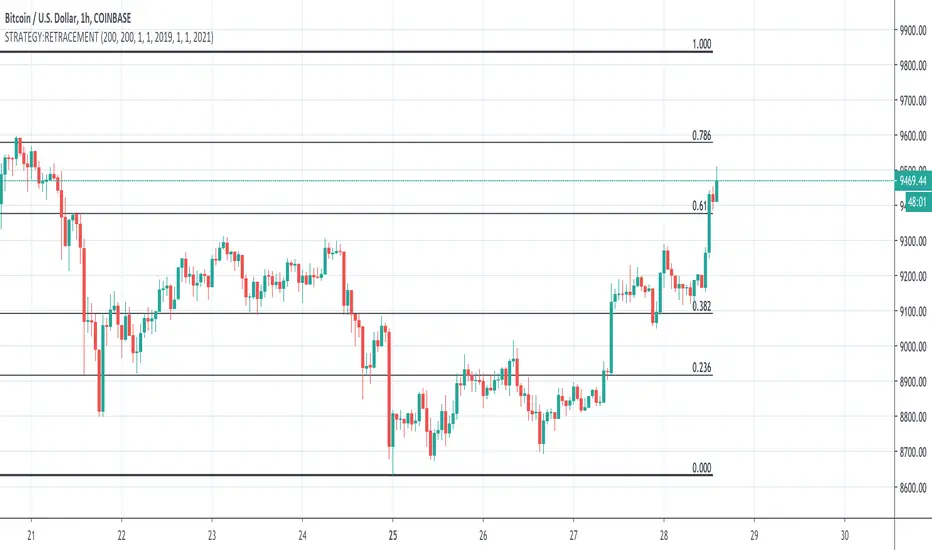
STRATEGY:RETRACEMENTThis is a basic script meant to help you identify Fibonacci Retracement Levels. Based on the high and low lookback periods you input, it will draw lines for the highest high and lowest low for those times as well as the Fibonacci Retracement Levels in between.
KBL Trend - Master Pro v1KBL Trend Master is Specially design to detect the upcoming and current trend using Price action and ATR based combined Trading strategy.
When KBL Trend - Master line indicated with Green color and price is above the KBL Trend - Master Line , Then the trend is in buy side and a buy trade is preferred.
And same for sell trade,
When KBL Trend - Master line indicated with Orange color and price is Below the KBL Trend - Master Line , Then the trend is in sell side and a sell trade is preferred.
In This Pro Version 1 , new studies have been added to give more crisp to the accuracy of the indicator.
We added following new parameters,
Added Buy Sell Signals
Added Back-test Option
Added Trend Bases Auto Signals
PM us to obtain access.

KBL Trend - Filter Pro v1KBL Trend Filter is a combination of Average true range and range breakout settings.
When KBL Trend -Filter Vertical line indicated with Green color and price cross over the candle on which the green vertical indicator came, then it is considered as a buy trades.
And same for sell trade,
When KBL Trend -Filter Vertical line indicated with Red color and price cross below the candle on which the Red vertical indicator came, then it is considered as a sell trades.
Change-log :
Few optimizations added for more smooth curves,
separated from main chart and added to separate chart window just below the main chart for easy visibility.
PM us to obtain access.

KBL Trend - MasterKBL Trend Master is Specially design to detect the upcoming and current trend using Price action and ATR based combined Trading strategy.
When KBL Trend - Master line indicated with Teal color and price is above the KBL Trend - Master Line , Then the trend is in buy side and a buy trade is preferred.
And same for sell trade,
When KBL Trend - Master line indicated with Orange color and price is Below the KBL Trend - Master Line , Then the trend is in sell side and a sell trade is preferred.
