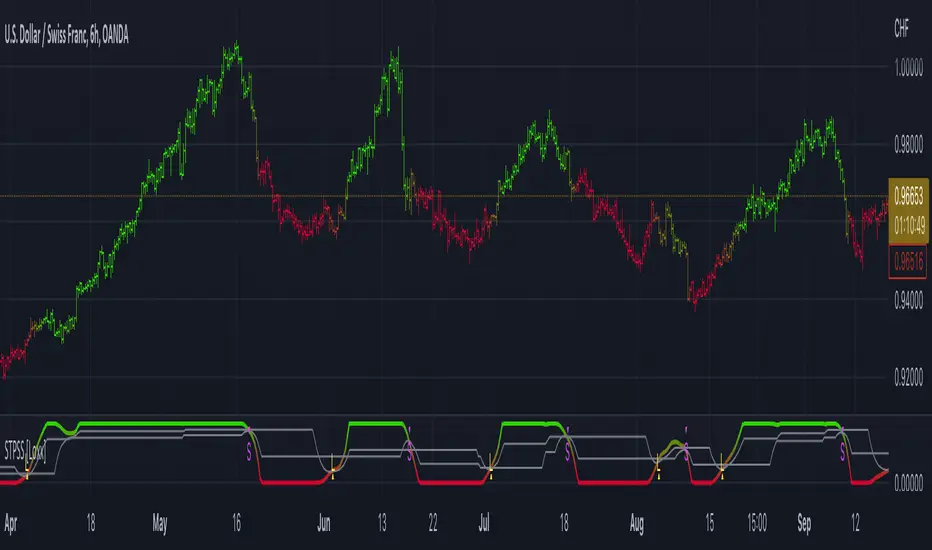
Vector ScalerVector Scaler is like Stochastic but it uses a different method to scale the input. The method is very similar to vector normalization but instead of keeping the "vector" we just sum the three points and average them. The blue line is the signal line and the orange line is the smoothed signal line. I have added the "J" line from the KDJ indicator to help spot divergences. Differential mode uses the delta of the input for the calculations. Here are some pictures to help illustrate how this works relative to other popular indicators.
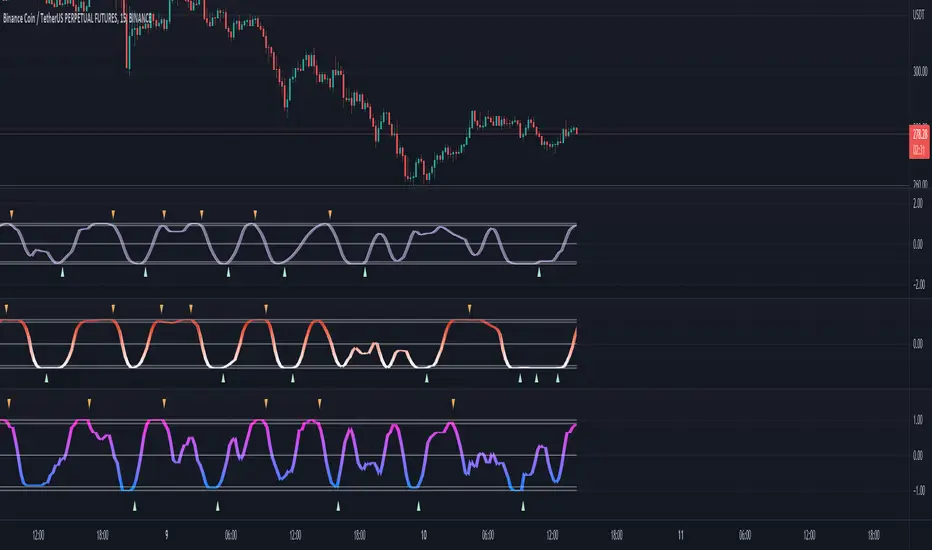
Vector Scaler vs Stochastic
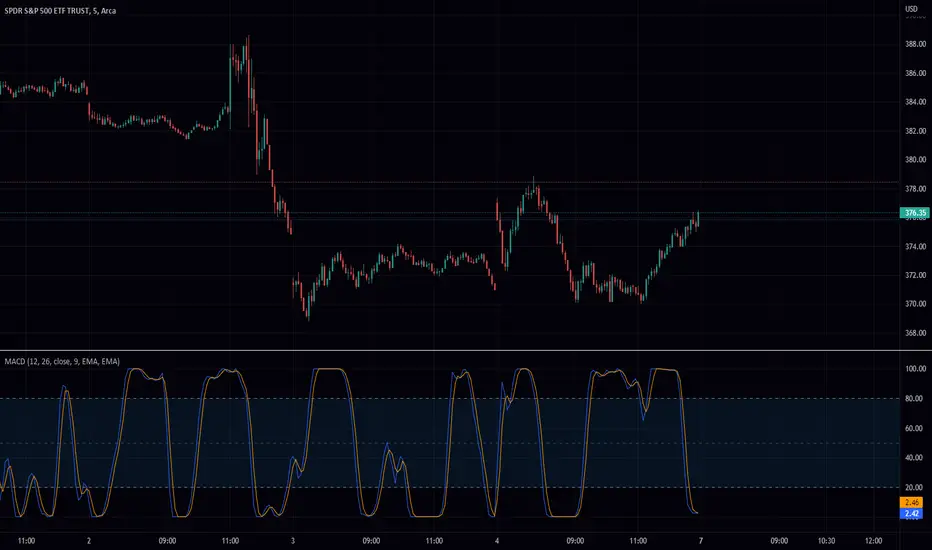
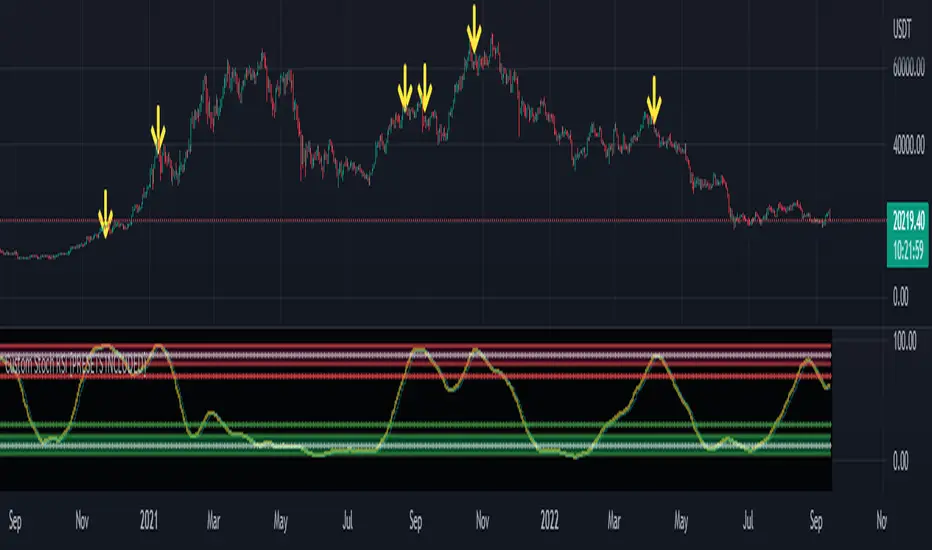
Vector Scaler vs Smooth Stochastic RSI
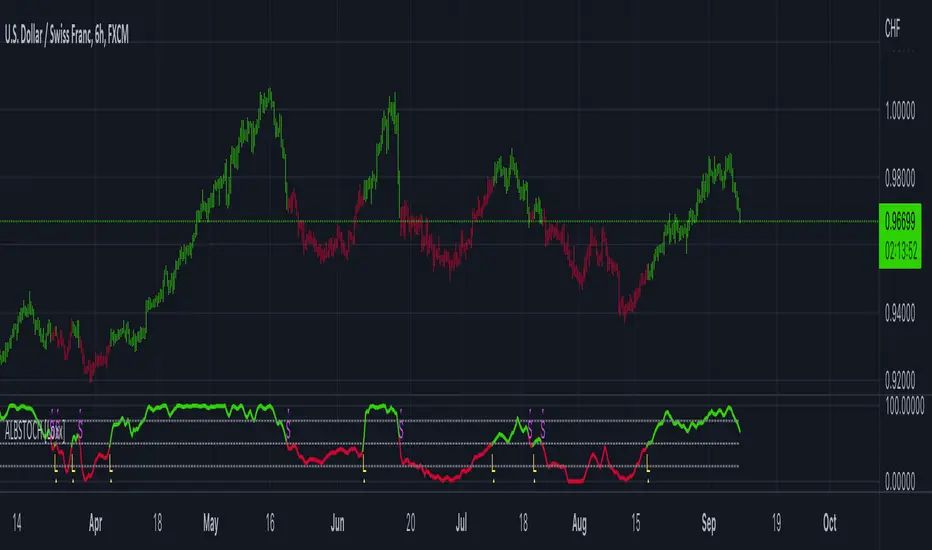
average set to 100
average set to 200
Indicador Pine Script®