STANDARD DEVIATION INDICATOR BY WISE TRADERWISE TRADER STANDARD DEVIATION SETUP: The Ultimate Volatility and Trend Analysis Tool
Unlock the power of STANDARD DEVIATIONS like never before with the this indicator, a versatile and comprehensive tool designed for traders who seek deeper insights into market volatility, trend strength, and price action. This advanced indicator simultaneously plots three sets of customizable Deviations, each with unique settings for moving average types, standard deviations, and periods. Whether you’re a swing trader, day trader, or long-term investor, the STANDARD DEVIATION indicator provides a dynamic way to spot potential reversals, breakouts, and trend-following opportunities.
Key Features:
STANDARD DEVIATIONS Configuration : Monitor three different Bollinger Bands at the same time, allowing for multi-timeframe analysis within a single chart.
Customizable Moving Average Types: Choose from SMA, EMA, SMMA (RMA), WMA, and VWMA to calculate the basis of each band according to your preferred method.
Dynamic Standard Deviations: Set different standard deviation multipliers for each band to fine-tune sensitivity for various market conditions.
Visual Clarity: Color-coded bands with adjustable thicknesses provide a clear view of upper and lower boundaries, along with fill backgrounds to highlight price ranges effectively.
Enhanced Trend Detection: Identify potential trend continuation, consolidation, or reversal zones based on the position and interaction of price with the three bands.
Offset Adjustment: Shift the bands forward or backward to analyze future or past price movements more effectively.
Why Use Triple STANDARD DEVIATIONS ?
STANDARD DEVIATIONS are a popular choice among traders for measuring volatility and anticipating potential price movements. This indicator takes STANDARD DEVIATIONS to the next level by allowing you to customize and analyze three distinct bands simultaneously, providing an unparalleled view of market dynamics. Use it to:
Spot Volatility Expansion and Contraction: Track periods of high and low volatility as prices move toward or away from the bands.
Identify Overbought or Oversold Conditions: Monitor when prices reach extreme levels compared to historical volatility to gauge potential reversal points.
Validate Breakouts: Confirm the strength of a breakout when prices move beyond the outer bands.
Optimize Risk Management: Enhance your strategy's risk-reward ratio by dynamically adjusting stop-loss and take-profit levels based on band positions.
Ideal For:
Forex, Stocks, Cryptocurrencies, and Commodities Traders looking to enhance their technical analysis.
Scalpers and Day Traders who need rapid insights into market conditions.
Swing Traders and Long-Term Investors seeking to confirm entry and exit points.
Trend Followers and Mean Reversion Traders interested in combining both strategies for maximum profitability.
Harness the full potential of STANDARD DEVIATIONS with this multi-dimensional approach. The "STANDARD DEVIATIONS " indicator by WISE TRADER will become an essential part of your trading arsenal, helping you make more informed decisions, reduce risks, and seize profitable opportunities.
Who is WISE TRADER ?
Wise Trader is a highly skilled trader who launched his channel in 2020 during the COVID-19 pandemic, quickly building a loyal following. With thousands of paid subscribed members and over 70,000 YouTube subscribers, Wise Trader has become a trusted authority in the trading world. He is known for his ability to navigate significant events, such as the Indian elections and stock market crashes, providing his audience with valuable insights into market movements and volatility. With a deep understanding of macroeconomics and its correlation to global stock markets, Wise Trader shares informed strategies that help traders make better decisions. His content covers technical analysis, trading setups, economic indicators, and market trends, offering a comprehensive approach to understanding financial markets. The channel serves as a go-to resource for traders who want to enhance their skills and stay informed about key market developments.
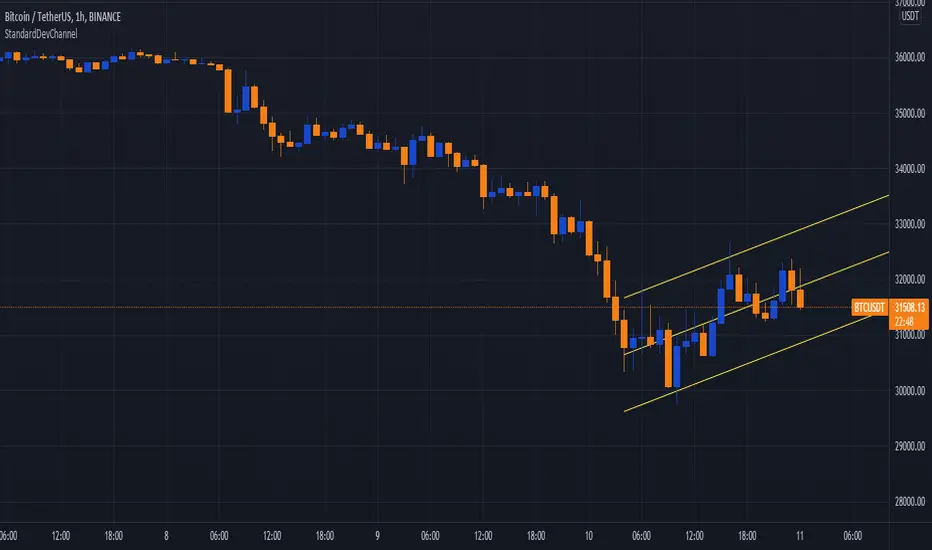
Standarddevchannel

Standard Deviation based Upper Lower RangeThis script makes use of historical data for finding the standard deviation on daily returns. Based on the mean and standard deviation, the upper and lower range for the stock is shown upto 2x standard deviation. These bounds can be treated as volatility range for the next n trading sessions. This volatility is based on historical data. Users can change the lookback historical period, and can also set the time period (days) for upcoming trading sessions.
This indicator can be useful in determining stoploss and target levels along with the traditional support/resistance levels. It can also be useful in option trading where one needs to determine a range beyond which it is safe to sell an option.
A range of 1 SD has around 65% to 68% probability that it will not be breached. A range of 2 SD has around 95% probability that it will not be breached.
The indicator is based on Normal distribution theory. In future editions, I envision to also calculate the skewness and kurtosis so that we can determine if a stock is properly following Normal Distribution theory. That may further favor the calculated range.

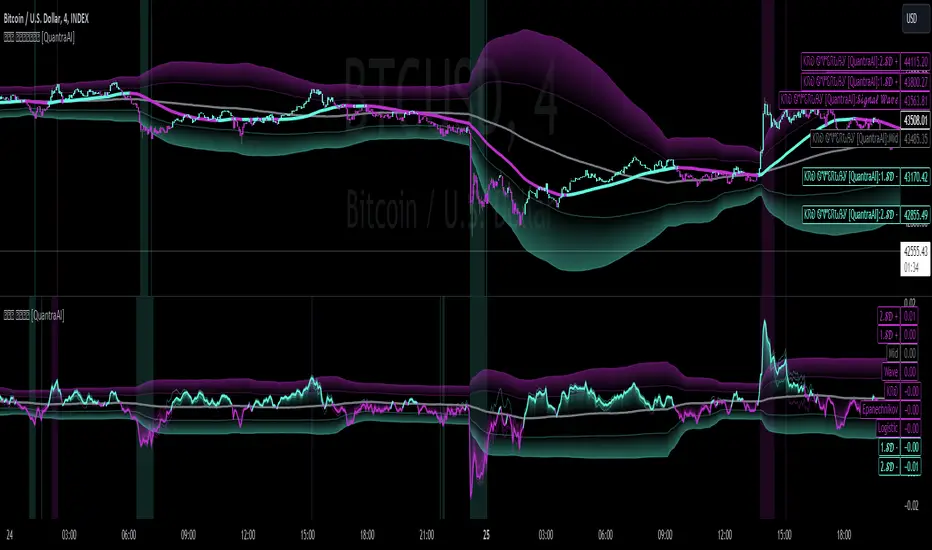
Triple Confirmation Kernel Regression Base [QuantraSystems]Kernel Regression Oscillator - BASE
Introduction
The Kernel Regression Oscillator (ᏦᏒᎧ) represents an advanced tool for traders looking to capitalize on market trends.
This Indicator is valuable in identifying and confirming trend directions, as well as probabilistic and dynamic oversold and overbought zones.
It achieves this through a unique composite approach using three distinct Kernel Regressions combined in an Oscillator. The additional Chart Overlay Indicator adds confidence to the signal.
This methodology helps the trader to significantly reduce false signals and offers a more reliable indication of market movements than more widely used indicators can.
Legend
The upper section is the Overlay. It features the Signal Wave to display the current trend.
Its Overbought and Oversold zones start at 50% and end at 100% of the selected Standard Deviation (default σ = 3), which can indicate extremely rare situations which can lead to either a softening momentum in the trend or even a mean reversion situation.
The lower one is the Base Chart - This Indicator.
It features the Kernel Regression Oscillator to display a composite of three distinct regressions, also displaying current trend.
Its Overbought and Oversold zones start at 50% and end at 100% of the selected Standard Deviation (default σ = 2), which can indicate extremely rare situations.
Case Study
To effectively utilize the ᏦᏒᎧ, traders should use both the additional Overlay and the Base
Chart at the same time. Then focus on capturing the confluence in signals, for example:
If the 𝓢𝓲𝓰𝓷𝓪𝓵 𝓦𝓪𝓿𝓮 on the Overlay and the ᏦᏒᎧ on the Base Chart both reside near the extreme of an Oversold zone the probability is higher than normal that momentum in trend may soften or the token may even experience a reversion soon.
If a bar is characterized by an Oversold Shading in both the Overlay and the Base Chart, then the probability is very high to experience a reversion soon.
In this case the trader may want to look for appropriate entries into a long position, as displayed here.
If a bar is characterized by an Overbought Shading in either Overlay or Base Chart, then the probability is high for momentum weakening or a mean reversion.
In this case the trade may have taken profit and closed his long position, as displayed here.
Please note that we always advise to find more confluence by additional indicators.
Recommended Settings
Swing Trading (1D chart)
Overlay
Bandwith: 45
Width: 2
SD Lookback: 150
SD Multiplier: 2
Base Chart
Bandwith: 45
SD Lookback: 150
SD Multiplier: 2
Fast-paced, Scalping (4min chart)
Overlay
Bandwith: 75
Width: 2
SD Lookback: 150
SD Multiplier: 3
Base Chart
Bandwith: 45
SD Lookback: 150
SD Multiplier: 2
Notes
The Kernel Regression Oscillator on the Base Chart is also sensitive to divergences if that is something you are keen on using.
For maximum confluence, it is recommended to use the indicator both as a chart overlay and in its Base Chart.
Please pay attention to shaded areas with Standard Deviation settings of 2 or 3 at their outer borders, and consider action only with high confidence when both parts of the indicator align on the same signal.
This tool shows its best performance on timeframes lower than 4 hours.
Traders are encouraged to test and determine the most suitable settings for their specific trading strategies and timeframes.
The trend following functionality is indicated through the "𝓢𝓲𝓰𝓷𝓪𝓵 𝓦𝓪𝓿𝓮" Line, with optional "Up" and "Down" arrows to denote trend directions only (toggle “Show Trend Signals”).
Methodology
The Kernel Regression Oscillator takes three distinct kernel regression functions,
used at similar weight, in order to calculate a balanced and smooth composite of the regressions. Part of it are:
The Epanechnikov Kernel Regression: Known for its efficiency in smoothing data by assigning less weight to data points further away from the target point than closer data points, effectively reducing variance.
The Wave Kernel Regression: Similarly assigning weight to the data points based on distance, it captures repetitive and thus wave-like patterns within the data to smoothen out and reduce the effect of underlying cyclical trends.
The Logistic Kernel Regression: This uses the logistic function in order to assign weights by probability distribution on the distance between data points and target points. It thus avoids both bias and variance to a certain level.
kernel(source, bandwidth, kernel_type) =>
switch kernel_type
"Epanechnikov" => math.abs(source) <= 1 ? 0.75 * (1 - math.pow(source, 2)) : 0.0
"Logistic" => 1/math.exp(source + 2 + math.exp(-source))
"Wave" => math.abs(source) <= 1 ? (1 - math.abs(source)) * math.cos(math.pi * source) : 0.
kernelRegression(src, bandwidth, kernel_type) =>
sumWeightedY = 0.
sumKernels = 0.
for i = 0 to bandwidth - 1
base = i*i/math.pow(bandwidth, 2)
kernel = kernel(base, 1, kernel_type)
sumWeightedY += kernel * src
sumKernels += kernel
(src - sumWeightedY/sumKernels)/src
// Triple Confirmations
Ep = kernelRegression(source, bandwidth, 'Epanechnikov' )
Lo = kernelRegression(source, bandwidth, 'Logistic' )
Wa = kernelRegression(source, bandwidth, 'Wave' )
By combining these regressions in an unbiased average, we follow our principle of achieving confluence for a signal or a decision, by stacking several edges to increase the probability that we are correct.
// Average
AV = math.avg(Ep, Lo, Wa)
The Standard Deviation bands take defined parameters from the user, in this case sigma of ideally between 2 to 3,
to help the indicator detect extremely improbable conditions and thus take an inversely probable signal from it to forward to the user.
The parameter settings and also the visualizations allow for ample customizations by the trader. The indicator comes with default and recommended settings.
For questions or recommendations, please feel free to seek contact in the comments.
dharmatech : Standard Deviation ChannelDESCRIPTION
Based on version by leojez.
Adds a 3rd standard deviation level.
Twice as fast as original version.
Refactored and simplified source code.
HOW TO USE
Load your chart
Adjust the timeframe and zoom of the chart so that the trend you're interested in is in view.
Add the indicator
Use the measuring tool to measure the number of bars from the start of the trend to the latest candle.
Open settings for the indicator.
Set the length value to the number of bars that you noted.

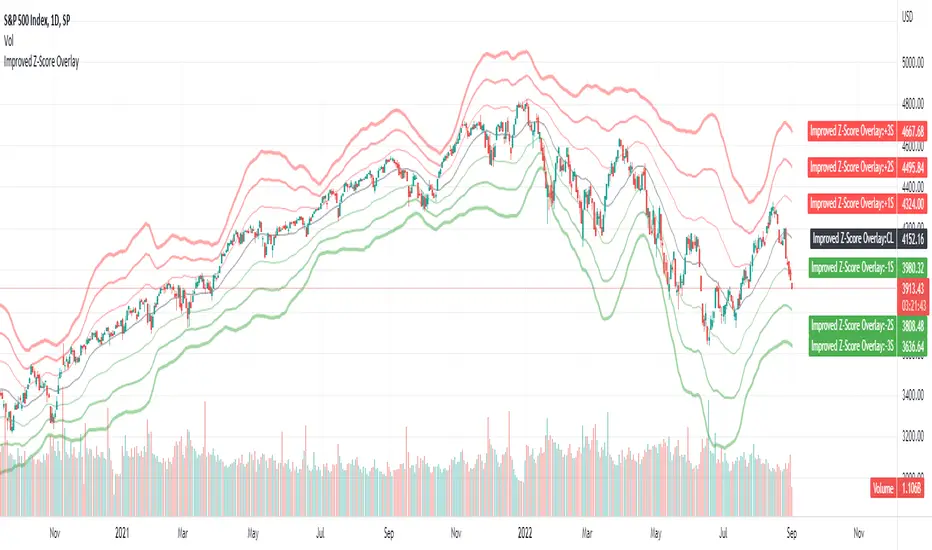
Improved Z-Score OverlayLast month I published an improved z-score script that goes underneath your chart, which helps to highlight overbought or oversold regimes. It is customizable, and allows changing the periods, whether smoothing capability is desired, whether to use simple or exponential moving averages, and which data source to use (open, high, low, close, ohlc4).
Some individuals may find that it is most useful not only to have the z-score visible underneath their price chart, but have the sigma values clearly visible on the chart itself to determine overbought or oversold levels.
Therefore, this improved z-score overlay script will place the centerline of price on the chart, and +3/+2/+1/0/-1/-2/-3 sigma.
These can be disabled if some values do not want to be shown, and the colors / opacity can be changed.
Additionally, you could also put this into a new pane below your chart and disable all of the +3 to -3 sigma values, and enable the "Z-Score" button. This will allow you to replicate the original Improved Z-Score Script.
If anyone has questions or would like to have any improvements made, let me know :)
- Jim Bosse
Standard Deviation Channels (ThinkorSwim identical)Saw the standard deviation channels indicator on ThinkorSwim and found a way to replicate it. However, the full range (kind of useless feature) is not the same as ThinkorSwim, but using without full range and setting your own length will be identical to the same length on ThinkorSwim. If you have any recommendations of your trading strategy using this, how to make the script better or any additions, they would be very helpful to suggest.