Cap.America S.H.I.E.L.D The Cap.America indicator
It is made up of 5 accessories
1- Supports and dynamic resistances
2 - Rsi, period (4) with ceiling and floor of 90 - 10. When overbought or oversold, the (Sell - Buy) signal will appear
3- Rsi, period (3)
They are ceiling and floor 95 - 5, when being over bought or sold a black arrow will appear as a warning sign. the confirmation of sale or purchase is when the date changes to green or red, with the minimum or maximum text reached.
4- Rsi, period (2) plus an EMA period (3) included.
A little dot will appear at the junction of the ema with the rsi.
5- A tick signal will appear, when the price reaches a maximum or minimum
Soporte

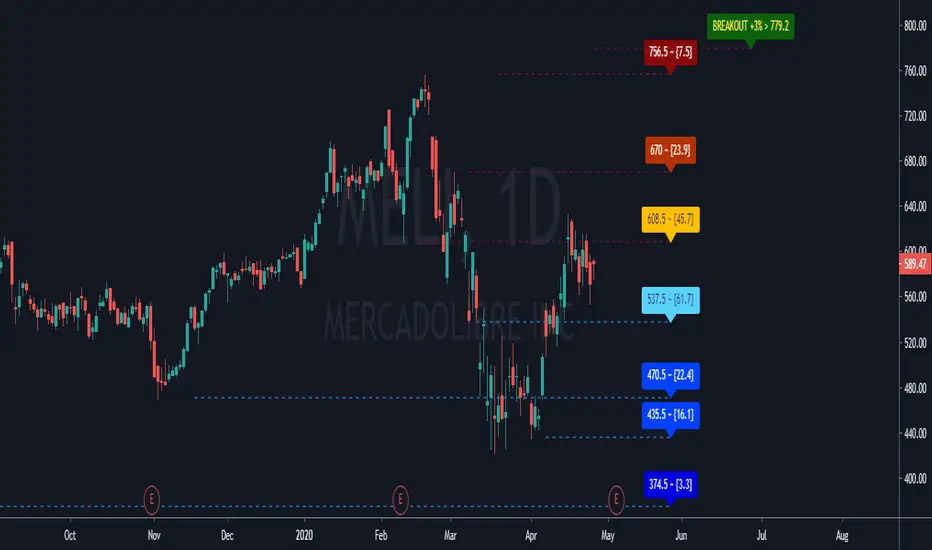
GC Supports & ResistancesThe indicator display the supports and resistances available. Breakout also are reported in case that not exists at least three resistances.
Does print lines and labels with each identified data (S, R and BO).
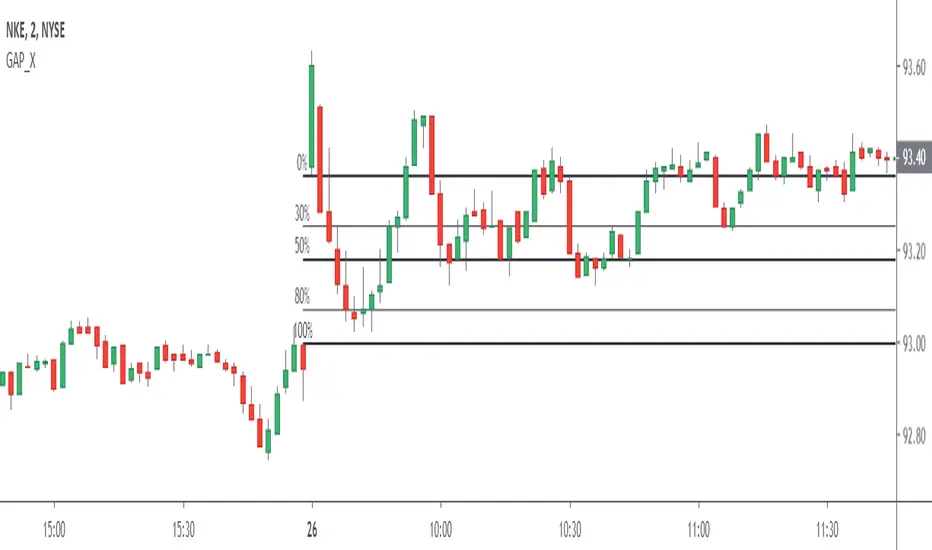
Gap Automatic Retrocess LevelsThis Script detects Bearish / Bullish GAP at market opening 09:30 am NY and automatically traces backward levels, of which 2 are configurable at your discretion.
JuanSe Highs-LowsIt shows the maximum and minimum of each month, week or day
They have several utilities, for example to detect the closest supports and resistances, to quickly visualize an uptrend (highest highs and lows), a downtrend (lowest highs and lows) or ranges (none of the above)
