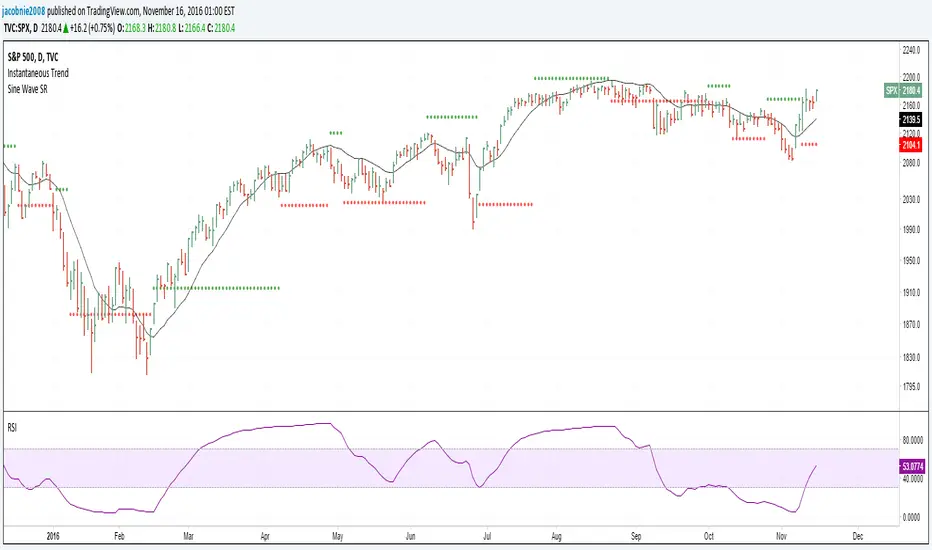
Capitalización del mercado de criptodivisas, BTC/USD, ETH/USD, USDT/USD, XRP/USD, Bitcoin
BANCO SANTANDER S.A, GRUPO FINANCIERO GALICIA SA, Apple, NETFLIX INC, Facebook Inc, Alibaba Group Hldg Ltd
IBEX 35, Índice DAX, Euro Stoxx 50, FTSE 100, S&P 500, Nikkei 225
Bono español 10 Años, Bono de EEUU 10 Años, Euro Bund, Alemania 10A, Japón 10A, Bono del Reino Unido 10 años
Support and Resistance plotted to match John Ehler's Hilbert Sine Wave
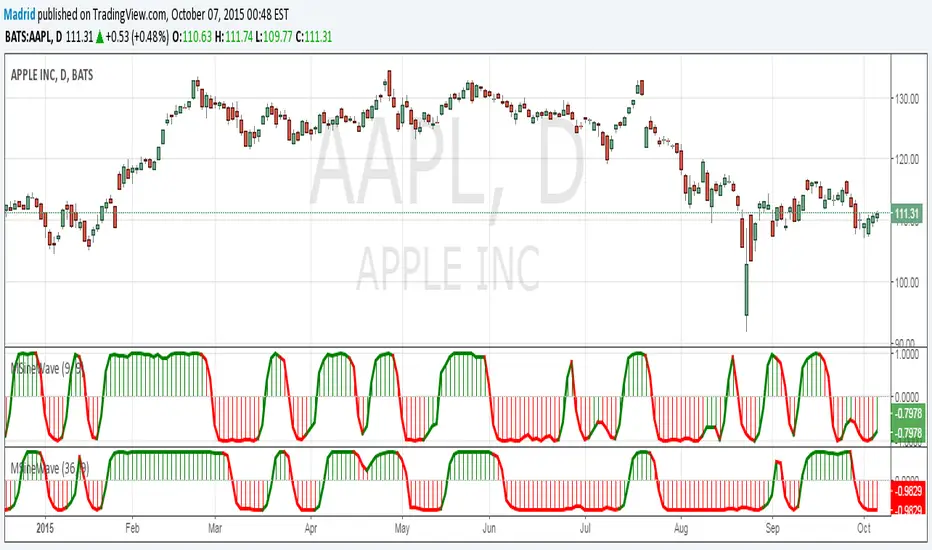
This implements the Even Better Sinewave indicator as described in the book Cycle Analysis for Traders by John F. Ehlers . In the example I used 36 as the cycle to be analyzed and a second cycle with a shorter period, 9, the larger period tells where the dominant cycle is heading, and the faster cycle signals entry/exit points and reversals.
The Sinewave Indicator was created by John Ehlers (Rocket Science For Traders pgs 97-99) and this is a few indicators in one. Simply put it is a leading indicator which you don't see too many of those these days. If the blue line crosses over the red line then within the next few bars the price will start an uptrend and if the blue line crosses below the red line...
The Sinewave Indicator was created by John Ehlers (Cybernetic Analysis For Stocks And Futures pgs 154-155) and this is an updated version of his original Sinewave Indicator which in my opinion seems to be more reactive to changes. Buy when the blue line crosses over the red line and sell when the blue line crosses under the red line. Also keep in mind that this...
The Even Better Sinewave Indicator was created by John Ehlers (Cycle Analytics For Traders pgs 161-162) and this indicator works well when the stock is in a trend mode. It will let you know how long to stay with a trade and it works best with a trend confirmation but it can also work on it's own fairly well. Buy when the indicator line is green and sell when it is...